Good for measuring performance or benchmarking, especially if all you can get your hands on is print.
pip install graphout
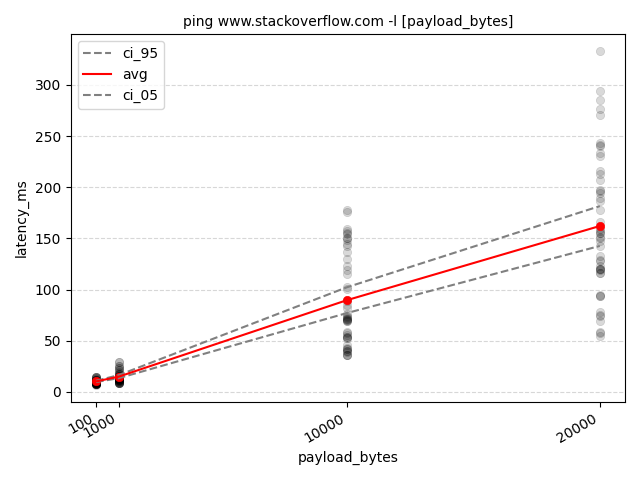
Execute ping 12 times using 6 parallel processes, parse the millisecond latency and make a graph.
graphout -n 12 --proc 6 --out ping_so -p 'latency_ms:time=([0-9]*)ms' --stack --rot-x -- ping www.stackoverflow.com -l [payload_bytes] -- 100 1000 10000 20000
         |--------------------------------- options --------------------------------|    |------------- command template ------------|    |----- values -----|
After running this, three things are going to happen:
- The ping command is going to be run 12 times for each
[100, 1000, 10000, 20000]value placed at[payload_bytes]in the command template. - The output is going to be parsed line-by-line and a
time=([0-9]*)msregex applied to extract the latency. - The numeric results and some charts are going to be put into a folder named
ping_so.
Each command configuration is going to contain up to 48 datapoints since each ping produces 4 measures, so 4 * 12 = 48.
However, ping can sometimes time out so less than 48 datapoints is also possible.
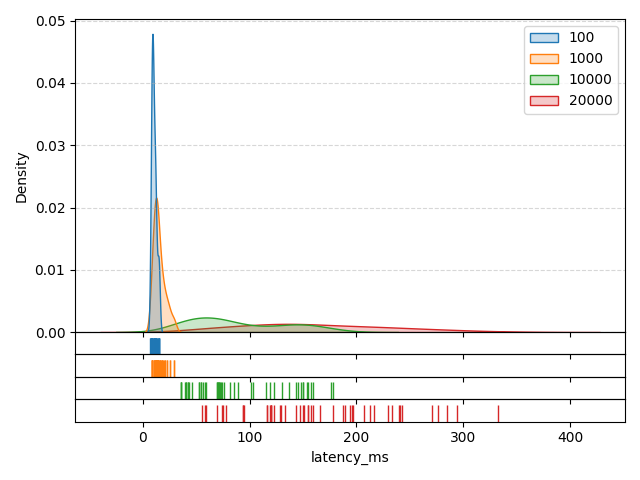
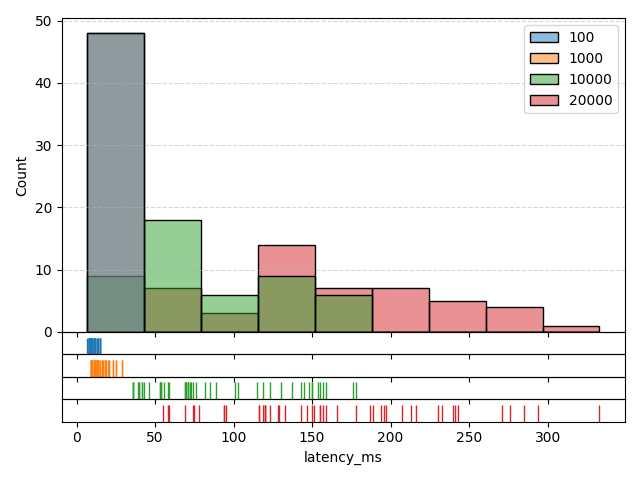
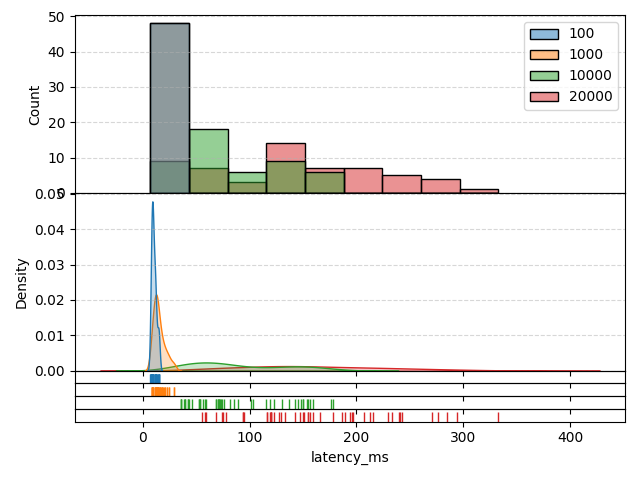
Separate per-parameter-value KDEs and histograms are also generated.
{
"base": "ping www.stackoverflow.com -l [payload_bytes]",
"runs": [
{
"command": "ping www.stackoverflow.com -l 100",
"x_name": "payload_bytes",
"x": "100",
"measures": {
"latency_ms": {
"stats": {
"cnt": 48,
"avg": 10.3125,
"std": 2.1846295756898293,
"min": 7.0,
"max": 15.0
},
"data": [
8.0,
8.0,
10.0,
10.0,
8.0,
9.0,
10.0,
14.0,
10.0,
11.0,
10.0,
14.0,
8.0,
11.0,
9.0,
13.0,
11.0,
9.0,
9.0,
8.0,
7.0,
9.0,
9.0,
9.0,
8.0,
9.0,
8.0,
9.0,
8.0,
12.0,
15.0,
11.0,
10.0,
9.0,
12.0,
12.0,
9.0,
12.0,
15.0,
11.0,
9.0,
12.0,
15.0,
9.0,
8.0,
12.0,
15.0,
11.0
]
}
}
},
{
"command": "ping www.stackoverflow.com -l 1000",
"x_name": "payload_bytes",
"x": "1000",
"measures": {
"latency_ms": {
"stats": {
"cnt": 48,
"avg": 15.0,
"std": 5.238970176536444,
"min": 9.0,
"max": 29.0
},
"data": [
9.0,
14.0,
21.0,
18.0,
12.0,
13.0,
12.0,
9.0,
9.0,
10.0,
18.0,
18.0,
11.0,
14.0,
16.0,
9.0,
9.0,
14.0,
13.0,
14.0,
9.0,
13.0,
14.0,
12.0,
13.0,
20.0,
29.0,
19.0,
11.0,
17.0,
25.0,
12.0,
13.0,
14.0,
29.0,
15.0,
13.0,
16.0,
21.0,
23.0,
11.0,
12.0,
25.0,
23.0,
10.0,
10.0,
16.0,
12.0
]
}
}
},
{
"command": "ping www.stackoverflow.com -l 10000",
"x_name": "payload_bytes",
"x": "10000",
"measures": {
"latency_ms": {
"stats": {
"cnt": 48,
"avg": 89.60416666666667,
"std": 44.4559258588957,
"min": 36.0,
"max": 178.0
},
"data": [
40.0,
70.0,
71.0,
69.0,
54.0,
36.0,
42.0,
43.0,
76.0,
130.0,
176.0,
85.0,
103.0,
74.0,
145.0,
115.0,
123.0,
101.0,
119.0,
143.0,
148.0,
155.0,
89.0,
178.0,
154.0,
39.0,
36.0,
40.0,
137.0,
72.0,
53.0,
58.0,
159.0,
53.0,
36.0,
42.0,
157.0,
82.0,
69.0,
70.0,
150.0,
59.0,
46.0,
56.0,
150.0,
73.0,
54.0,
71.0
]
}
}
},
{
"command": "ping www.stackoverflow.com -l 20000",
"x_name": "payload_bytes",
"x": "20000",
"measures": {
"latency_ms": {
"stats": {
"cnt": 48,
"avg": 162.10416666666666,
"std": 68.78682443834762,
"min": 55.0,
"max": 333.0
},
"data": [
78.0,
94.0,
94.0,
95.0,
133.0,
59.0,
55.0,
58.0,
187.0,
155.0,
120.0,
207.0,
240.0,
116.0,
196.0,
166.0,
285.0,
197.0,
159.0,
129.0,
333.0,
230.0,
216.0,
233.0,
213.0,
69.0,
74.0,
75.0,
241.0,
120.0,
119.0,
120.0,
243.0,
128.0,
123.0,
116.0,
271.0,
151.0,
147.0,
143.0,
276.0,
155.0,
157.0,
150.0,
294.0,
194.0,
189.0,
178.0
]
}
}
}
],
"args": "-n 12 --proc 6 --out ping_so -p latency_ms:time=([0-9]*)ms --stack --rot-x -- ping www.stackoverflow.com -l [payload_bytes] -- 100 1000 10000 20000"
}