Powerful tools and libraries for building data products.
- Turn Python code to diagrams with Diagrams
- Make mindmap with markdown: Markmap
- Charting tool using text and code: Mermaid
- Open-source tool to generate UML diagrams: PlantUML
Pro tip: you can use these tools in conjunction with ChatGPT/Bard/etc.
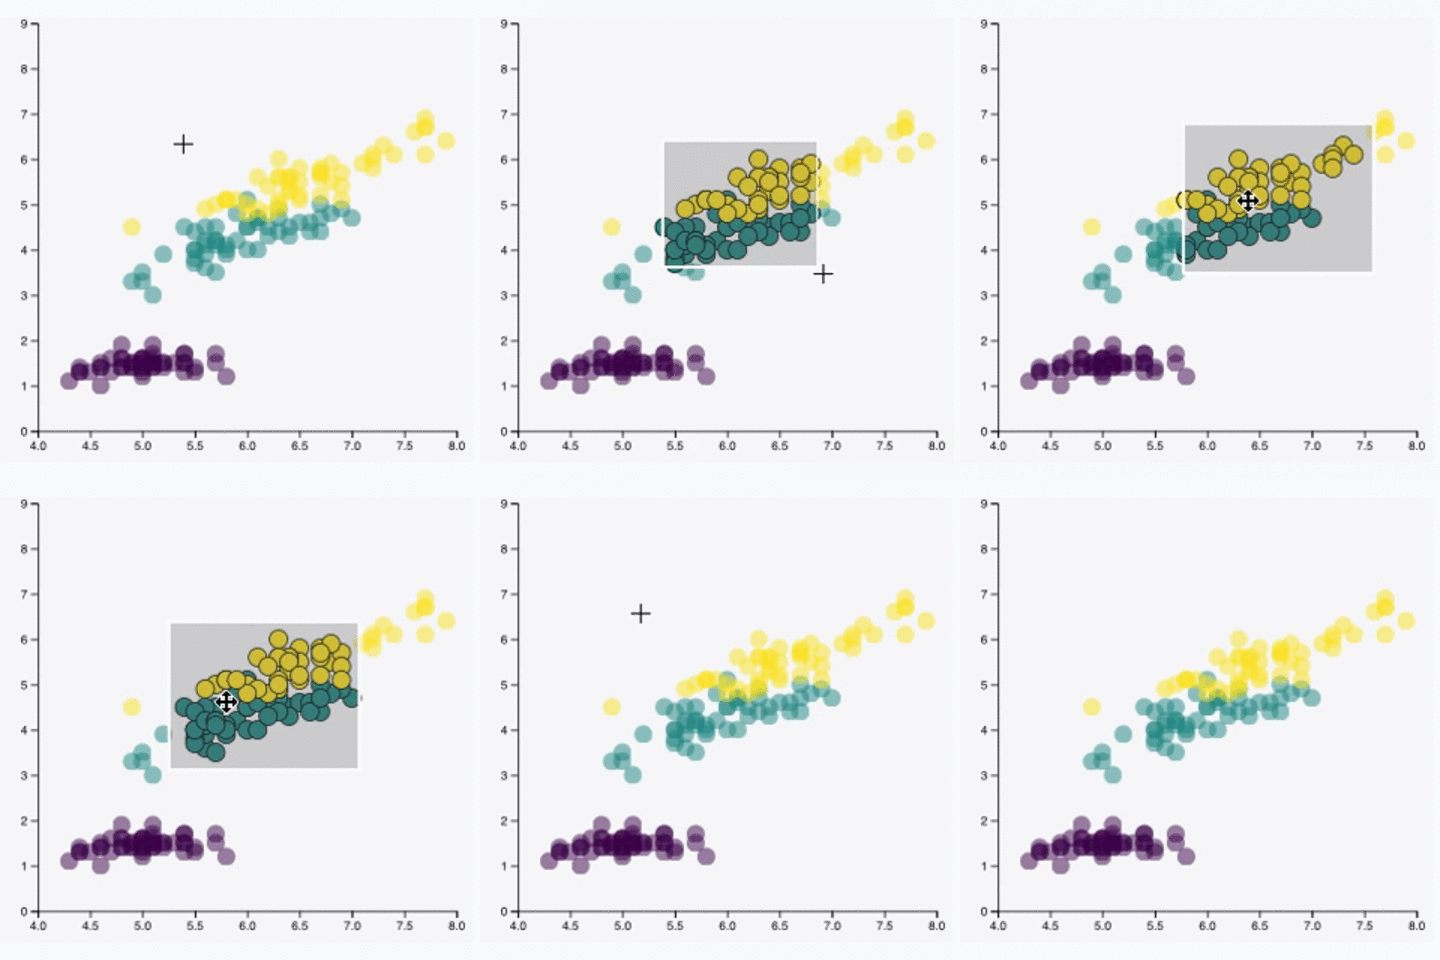
D3Blocks uses the graphics of d3 javascript (d3js) to create interactive and standalone plots that can be configured with Python.
CopilotKit is an open-source framework that lets us integrate AI into react applications with little code easily.

Winglang is an open-source programming language that abstracts away the differences between cloud providers by providing a standard infrastructural API. Winglang expresses both infrastructure and application logic in a safe and unified programming model with two execution phases:
- preflight for infrastructure definitions
- inflight for runtime code

Pigeon is an open-source annotation tool. One can annotate the dataset by simply defining buttons and labeling samples, as demonstrated below.

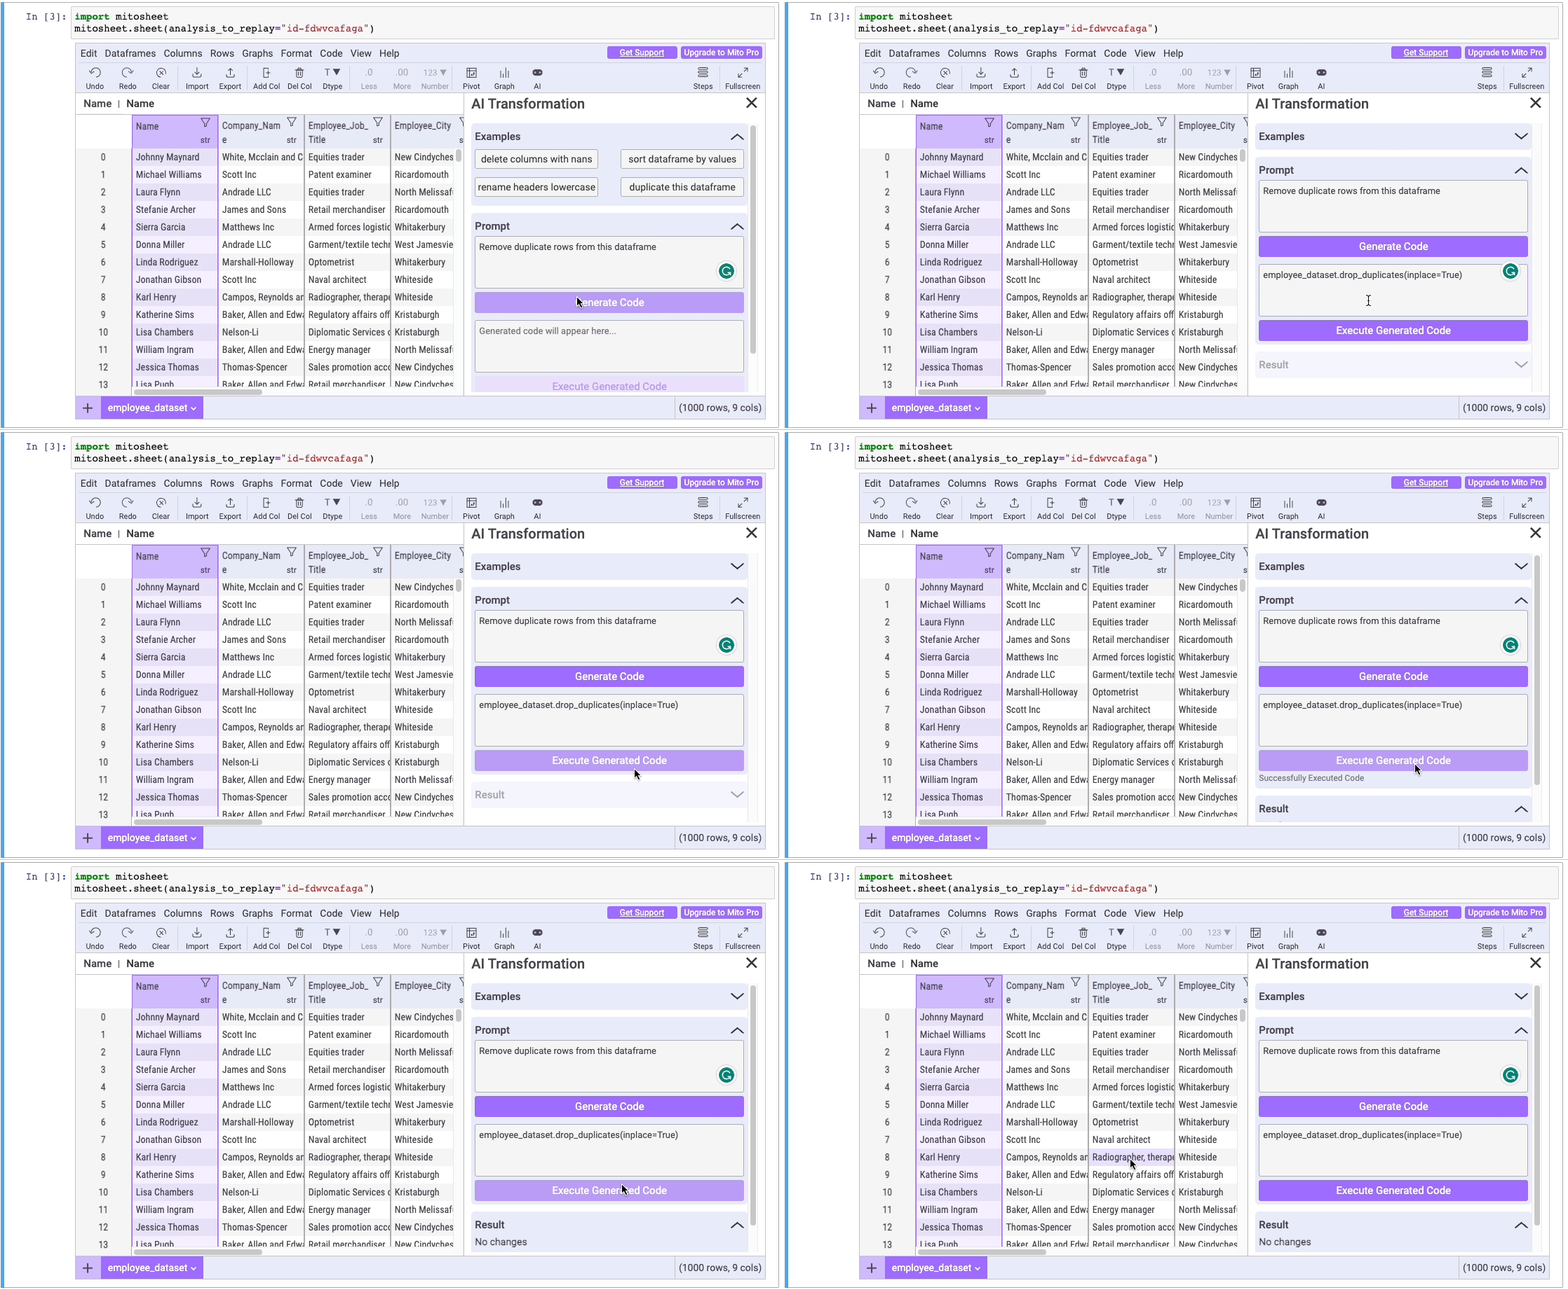
Mito is a no-code data analysis tool with spreadhsheet interface in Jupyter Notebook. Each edit in the spreadsheet will also generate the equivalent Python code.
Drawdata allows you to draw a dataset in Jupyter notebook by dragging the mouse.

PyGWalker allows you to open a Tableau-style interface for visual analysis. Note that Graphic Walker is an open-source alternative to Tableau.
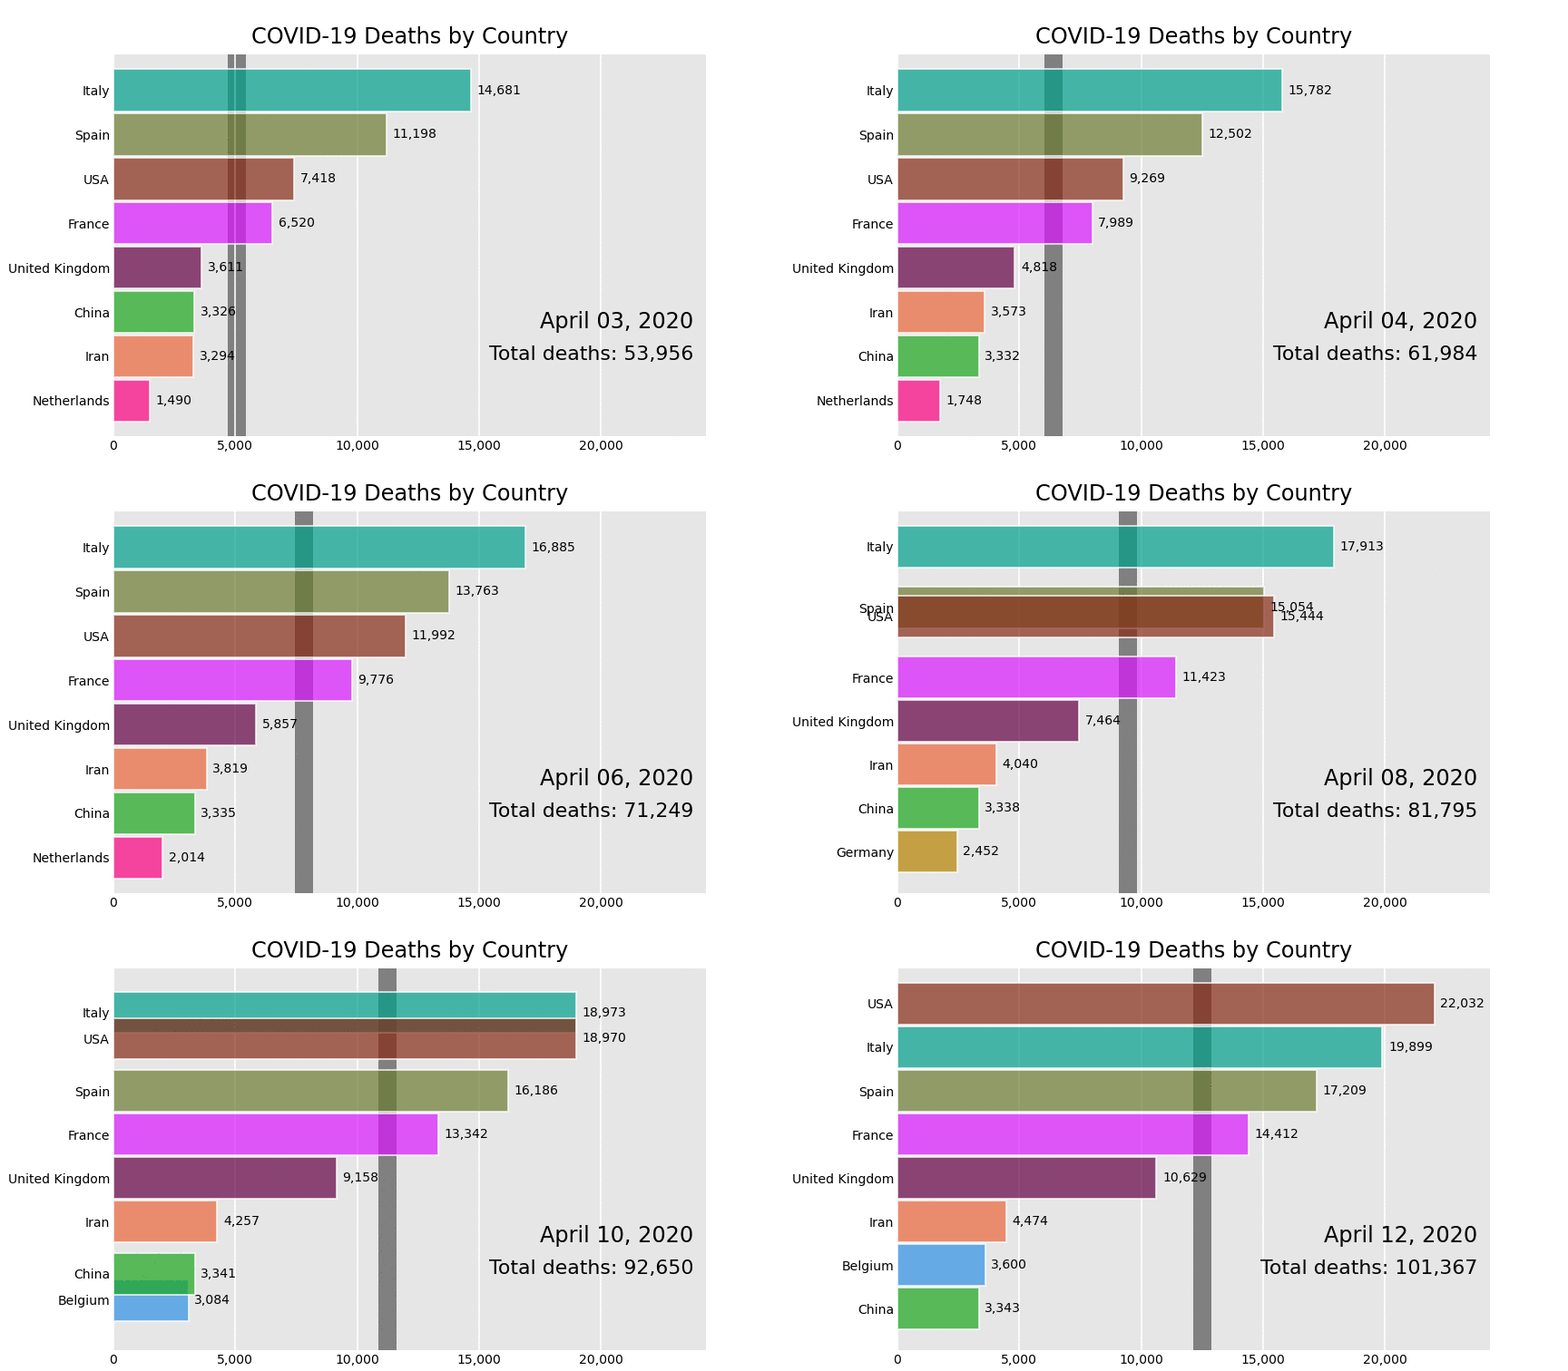
Bar-chart-race makes animated bar and line chart races with matplotlib or plotly.