Goal: combine data from various sources (such as social media, financial news, and user sentiments) to predict return and evaluate risk.
Two very important measures: Sharpe Ratio and Maximum Drawdown.
Notebooks:
- Create trading signals using moving averages via
rolling()method in pandas. - Implement trend-following strategy: long one share of stock if fast signal is above slow signal.
- Model stock return and measure financial risk when investing
- Estimate the confidence interval for the return of stocks or equity funds
- Validate assertion or specific claims (e.g. from fund managers) about investment returns
It is helpful to understand the terms used in the dataset:
- Open:
- Close: the last price at which the stock traded during the regular trading day
- High:
- Low:
- Adjusted Close = closing price after adjustments for all applicable splits and dividend distributions. See https://www.investopedia.com/terms/a/adjusted_closing_price.asp
- Volume = number of shares traded during the trading day. See https://www.schwab.com/learn/story/trading-volume-as-market-indicator
The daily return of a stock can be calculated, for e.g., using % difference in closing price.
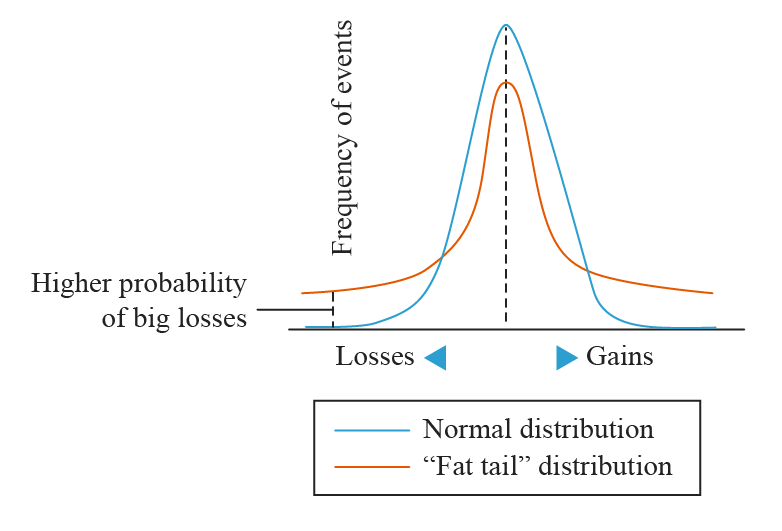
"Distributions of daily and monthly stock returns are rather symmetric about their means , but the tails are fatter (i.e. there are more outliers) than would be expected with normal distributions"
By Fama and French.


- Social Economics: Proxy Means Test
- Financial Economics: Credit Risk Modeling
- Credit Risk Modeling
- Customer Behaviour Analysis
- Recommendation