




An interactive color wheel application built with React and Vite. Explore, select, and copy colors with mathematical precision.

- Interactive Color Wheel: Hover or click anywhere on the canvas to select a color.
- Real-time Color Details: Instantly displays HSL, RGB, and Hex values of the selected color.
- Detailed Modal Popup: View expanded color information and preview in a clean modal.
- Responsive Design: Fully optimized for desktop, tablet, and mobile screens.
The color wheel is drawn with 36,000 uniquely colored dots arranged in a circular pattern. Each 1° segment represents a single hue, and the saturation increases with the distance from the center. Since there are 360 degrees in a circle (360 hues) and saturation is expressed in 100 percentage points, we get 360 × 100 = 36,000 dots when working with integers.
To draw these 36,000 dots in a circular pattern, we use the sine function to determine the Y coordinate and the cosine function to determine the X coordinate. JavaScript's Math.sin and Math.cos expect angles in radians, so we convert degrees to radians first (radians = degrees × π / 180). A full circle equals 360 degrees or 2π radians.

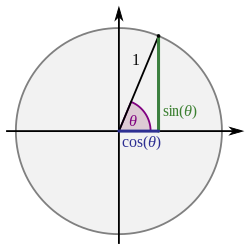
Image from wikimedia.org
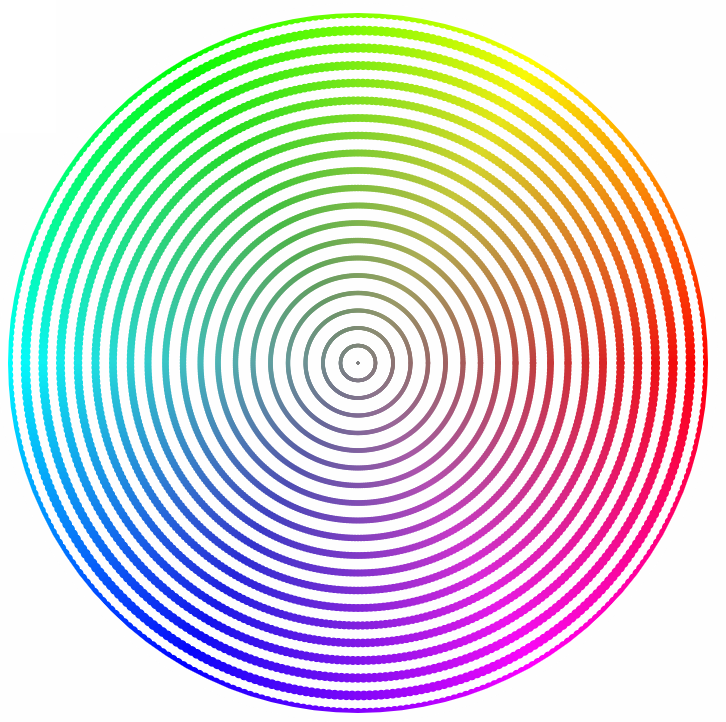
We use the saturation as the radius of our circle for each iteration (0 - 100). The color wheel consists of 100 circles with varying radius based on the saturation. If we draw every 5th saturation circle, the wheel would look like this:
Another way we can define the color wheel is by 360 1° segments with a different color. The angle (0 - 360) defines the hue (0 - 360) of the color. If we draw every 5th hue segment, the wheel would look like this:
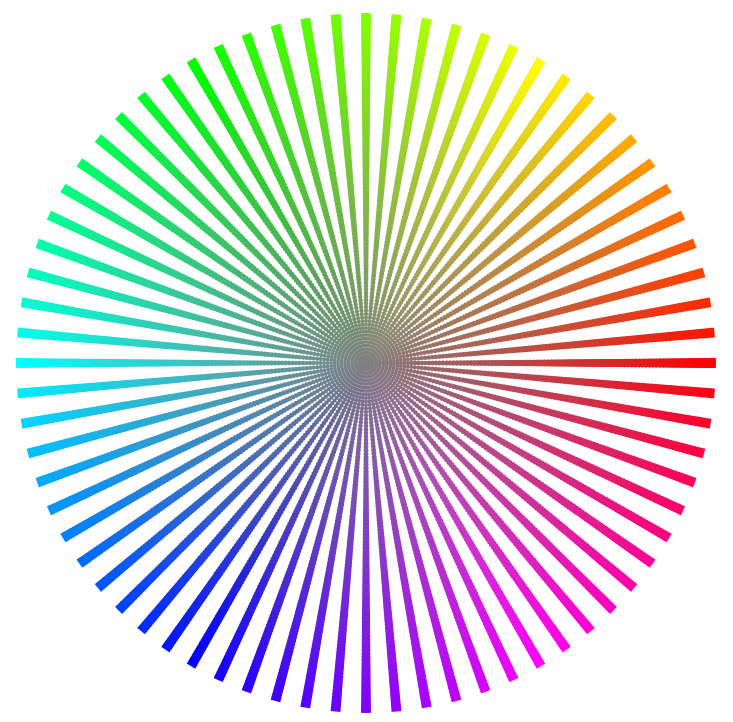
The first color in the hue scale (value 0) is red and lies directly to the right of the center of the wheel. This makes sense since we generally measure angles relative to the positive x-axis.

Image from wikimedia.org
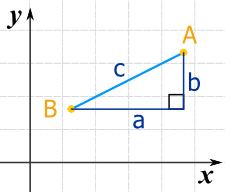
Image from mathsisfun.com
To determine the hue of the color based on the x value of the cursor, we need to inverse the cosine function we used to calculate the position of the dot in the color wheel. If we want to base ourselves on the y value, we have to inverse the sine function. In this case, we use the x value, and we quickly notice that there are always 2 colors for every given x value and distance from the center of the wheel. To get around this issue, we add a check to determine whether the cursor is above or below the vertical middle (y) of the wheel, and we inverse the hue value of the color when the cursor is below.
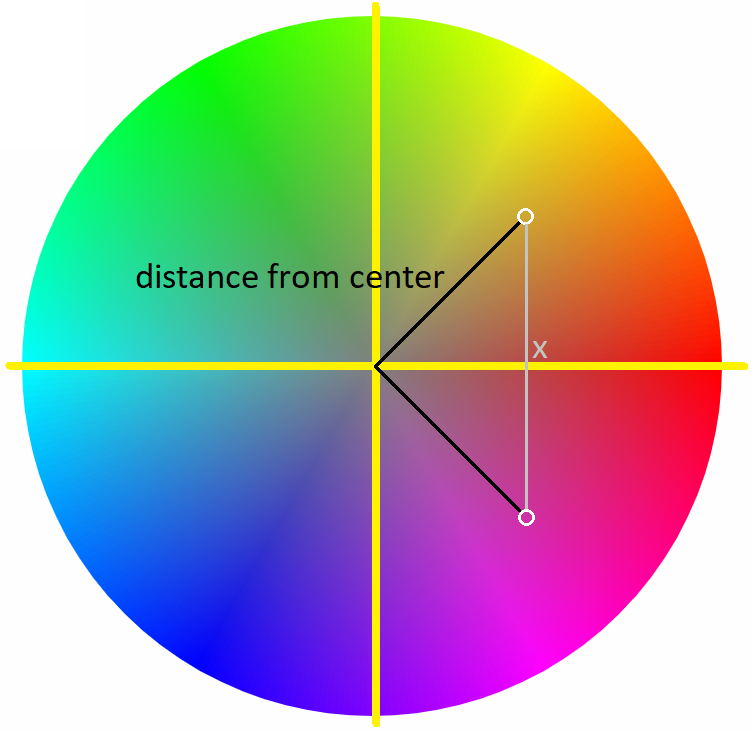
If we base ourselves on the y value to determine the hue, we will find 2 colors for every given y value and distance from the center, and we need to adapt the hue value based on the position of the cursor to the left or right of the horizontal middle (x) of the wheel.
For converting the colors in HSL (hue, saturation, lightness) notation to RGB (red, green, blue), we use the formula as explained at RapidTables. To convert the RGB value to hexadecimal notation, we just need to convert the base 10 integers (0 - 255) representing the red, green, and blue values to their hexadecimal equivalent.
- React - UI component library
- Vite - Fast frontend build tool & dev server
- JavaScript - Core application logic
- CSS3 - Styling & responsiveness
- Node.js (version 14 or higher)
- npm (version 6 or higher)
- Clone the repository:
git clone https://github.com/Prarambha369/ColorWheel.git
- Navigate to the project directory:
cd ColorWheel - Install dependencies:
npm install
- Start the development server:
npm run dev
- Open the application in your browser:
http://localhost:5173 (or the port displayed in your terminal)
