Overview
The Overview page (formerly Live Power; ⚡ in the sidebar) provides a real-time view of your grid connection, billing status, and — for UK users — carbon intensity and generation mix.
The page appears whenever EMT has something live to show — a power sensor, an Octopus Home Mini feed, or just a postcode (for carbon and generation-mix context). It no longer requires a dedicated power sensor: postcode-only installs still get the generation mix, carbon intensity and billing cards.
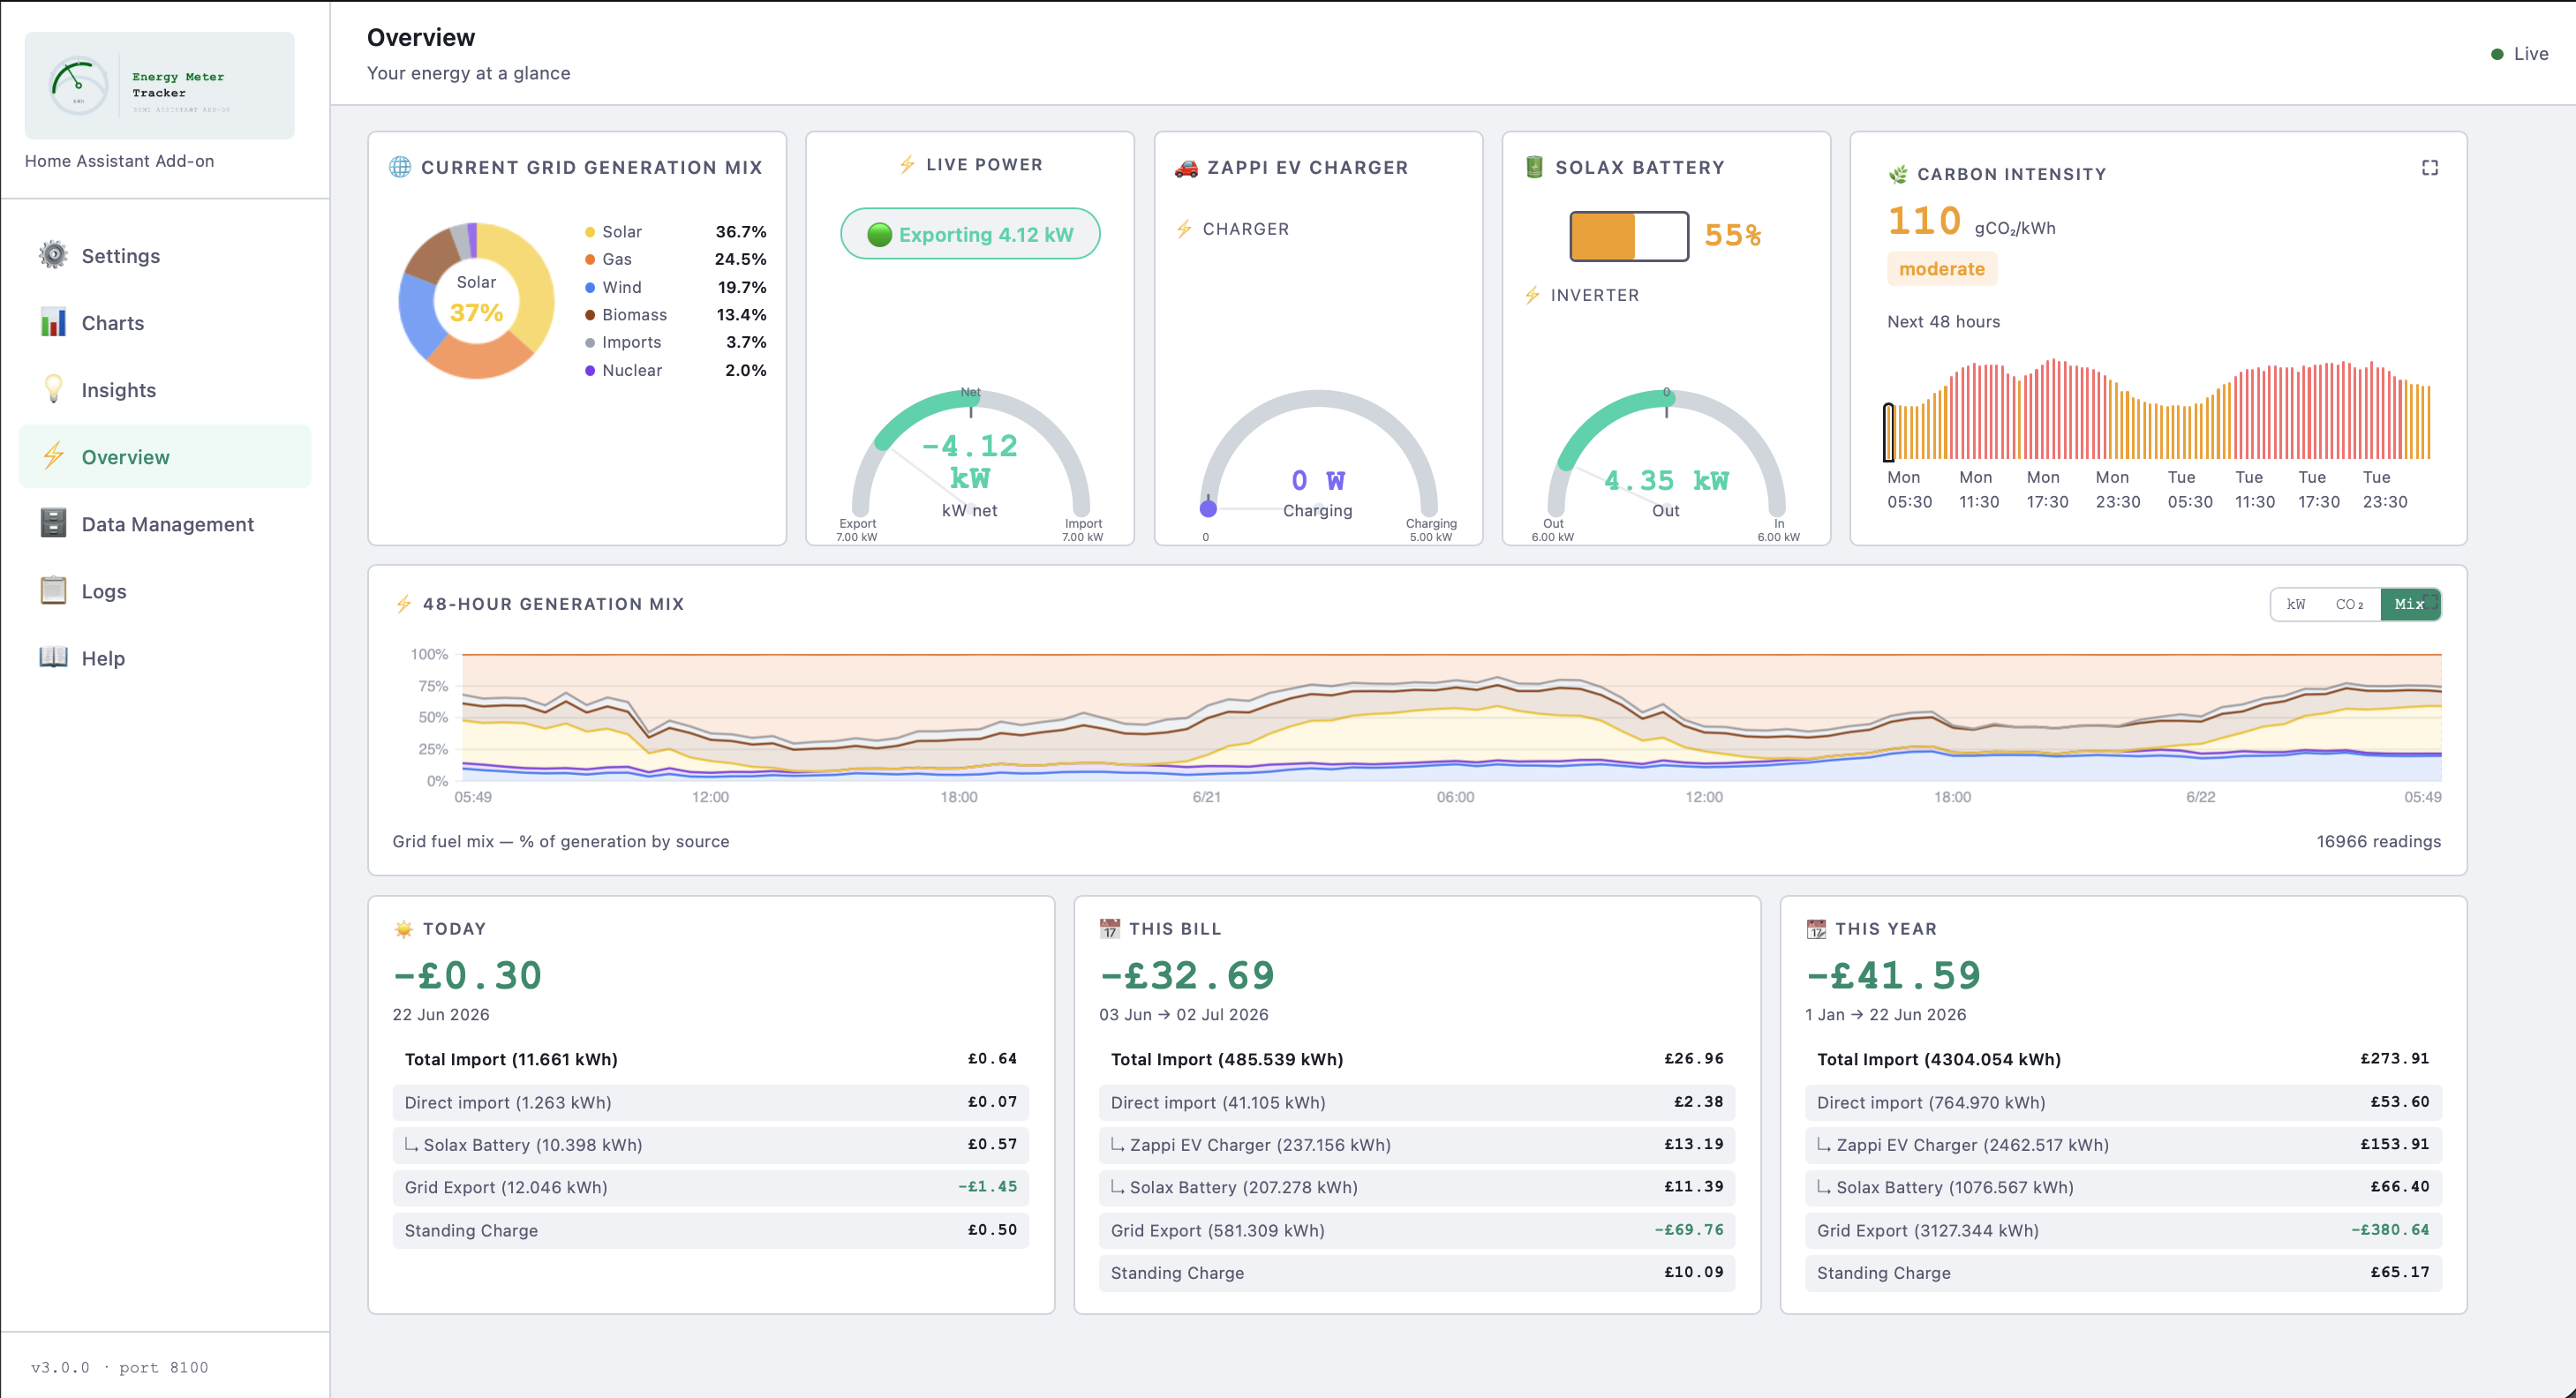
The gauge and 48-hour history can be driven by either:
- A power sensor — live net power in W or kW, configured on the main meter in Settings → Meter Config.
- An Octopus Home Mini — if you have one, EMT can use its real-time demand feed as the live-power source without a separate CAD sensor. See Supplier Settlement.
If neither is present but a postcode is configured, the page still shows generation mix, carbon intensity and billing cards (without the live gauge).
A donut chart showing the current half-hour's fuel split for your grid region (🇬🇧 UK only — requires postcode prefix configured).
- Hover any segment to see that fuel's name and percentage in the centre of the donut
- Colours follow the Ember/NESO convention: wind=blue, solar=gold, nuclear=deep purple, gas=orange, biomass=brown, hydro=sky blue
- Updates every ~15 minutes when new carbon intensity data is fetched
- Only shown when a postcode prefix is configured in Meter Config
The main gauge shows net grid flow in real time.
- Positive values = importing from grid (shown in the import colour)
- Negative values = exporting to grid (shown in teal/green)
- The scale is asymmetric — import and export maximum values are derived from your 48-hour usage history (p90 percentile) so the needle uses the full arc range for typical values
- Colour reflects carbon intensity in the UK (green = clean, red = carbon-heavy) or import magnitude globally
Each configured device with a device type and power sensor gets its own card.
- Unidirectional gauge showing live charging power
- V2X-capable chargers show a bidirectional gauge (discharge = export direction)
- SoC dial (0–100%) with green → amber → red colour shift
- Inverter power gauge showing charge/discharge power in kW
- Unidirectional gauge showing live consumption
Configure power sensors, SoC sensors and inverter power sensors for each device in Settings → Meter Config. Any power sensor can be sign-inverted or have its unit forced to W/kW there — see Configuring Meters.
The Carbon Intensity card shows the current regional intensity in gCO₂/kWh and a colour-coded label (very low / low / moderate / high / very high).
Below the headline value, a 48-hour forecast bar chart shows upcoming intensity, colour-coded from green (low) through amber to red (high). Use this to decide when to:
- Schedule EV or battery charging
- Run high-consumption appliances
- Export from your battery
Requires a postcode prefix in Meter Config.
The lower section of the page shows a rolling 48-hour chart. Three modes are available via the toggle in the top right:
Net grid power over time. Import shown as a red fill area above zero, export as a teal/green fill area below zero. Drag to zoom, double-click to reset. Hover for a tooltip showing local time, net kW, and current intensity.
Carbon rate (gCO₂/min) over time. Red = emitting (net import), green = offsetting (net export). Only available with postcode configured.
Stacked area chart showing % of generation by fuel type over the last 48 hours. Clean fuels (wind, nuclear, solar) stack at the bottom; dirty fuels (gas, coal) sit prominently at the top. Same zoom and hover tooltip as kW mode. Updates at CI-tick resolution (~15 min) — stays current regardless of block size.
Below the gauges, three billing cards show running totals:
| Card | Description |
|---|---|
| Today | Import, export, device breakdown and standing charge for the current calendar day |
| This Bill | Running total for the current billing period (uses your billing history — correct even if billing day has changed) |
| This Year | Running total since 1 January |
Each card shows:
- Total import cost with device breakdown (Direct import, EV, Battery etc.)
- Export credit
- Standing charge
- Net cost (import − export)
In Settings → Meter Config, the main meter card has two optional fields that control the Overview page:
| Field | Description |
|---|---|
| Power sensor | Live net power in W or kW — e.g. sensor.smart_meter_electricity_power
|
| Postcode prefix | 🇬🇧 UK only — e.g. DE1 — enables carbon intensity and generation mix features |
Device cards appear once a Meter Type and a Device power sensor or SoC sensor are configured for that device.