VBET Sausage Links - Metrics wishlist brainstorm #108

Replies: 5 comments 12 replies

|
@MattReimer this is where we laid out the Masking ideas. @lauren-herbine and @shelbysawyer, please have a read and start asking questions if anything isn't clear here. |

|
@joewheaton thanks for flushing this out. @Cashe93 and I have been brainstorming about similar metrics for the on-screen digitizing that we have been doing for the BLM and BoR in Utah so it's great to see that we are coming up with similar and the same metrics. I understand the Metrics you have come up and think that they will add a ton of value but I'm not sure what you are asking for. Is it an attribute table in a shapefile that we populate and pass on to NAR, or what? Please let me know and then we'll work on the task. |
|
Just a reminder to folks, please provide some critical feedback here. @lauren-herbine and @shelbysawyer I will ask you to provide yours in some vignettes you can link to from here. |
|
@joewheaton , @lauren-herbine , @shelbysawyer @Cashe93 Here is some feedback on the Global Metrics: Geometry
Interactive Tools Active/inactive floodplain comparisons
Detrended elevation thresholds
Recovery potential
|

|
@Cashe93 I want you to do as you described BUT the task at hand is something entirely different. Please re-read what Philip wrote above regarding VBET. @tyler1218hatch can you please help Cashe with understanding the task? |

|
@wally-mac gotcha. I've just met with Tyler and have a better grasp of what needs to be done. I'll keep you updated on progress. |

|
@Cashe93 @tyler1218hatch would you all mind briefly outlining what you discussed? It would be helpful for @shelbysawyer and I. Thanks! |
|
@lauren-herbine and @shelbysawyer Sure thing! For my benefit, we just went over what specifically needs to be done for this task and why. In a nutshell, we will be taking an existing VBET output and:
This will help us determine the feasibility of calculating each metric as well as help us narrow down which final set of metrics should be reported with each VBET output. My confusion spawned from some of the discussions that were had between the initial post and now and I just needed a push in the right direction. @tyler1218hatch feel free to add anything I may have missed. |
|
@lauren-herbine and @shelbysawyer, Tyler and I will be meeting tomorrow morning at 10:30 am to go over how we should be calculating some of these metrics. If you would like to join here is the zoom link. |

|
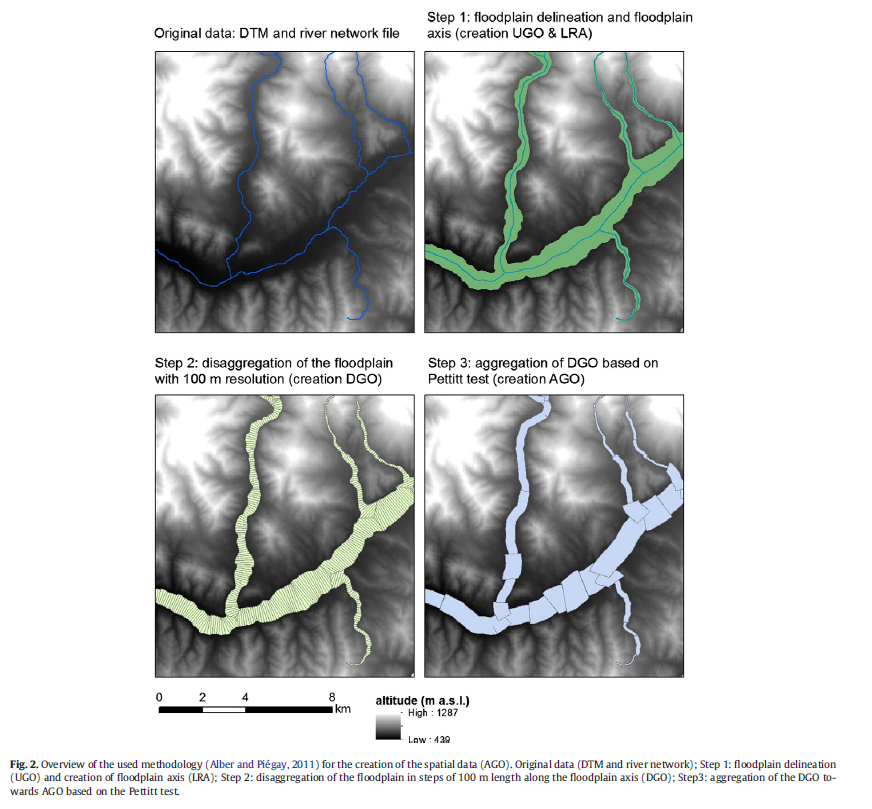
We've talked about users being able to specify their specific project area. When users do this, it seems very unlikely that their custom area would perfectly line up with our pre-determined "sausage" segments. This makes me wonder about the dashboard and its capabilities.. If the idea is to have a dashboard provide a set of metrics for each valley bottom segment (ex. proportion valley bottom by land ownership), are we only able to provide these metrics for the existing segments? What is our ability to do some of these metrics on the fly for custom areas which have either been digitized in the app by the user or uploaded via shapefile, etc? In terms of the metrics that VBET will provide.. my thought it that the report will mirror what can be accessed in the app. @lauren-herbine and I discussed the possibility of offering customized reports, meaning allowing users to specify the metrics they care about before downloading. Is it better just to offer a standardized report? What is our capability to do customized? I have additional questions, but I wanted to get some discussion rolling on these now. I can break these out into separate discussions if needed. |
|
@shelbysawyer here is some info from a discussion @joewheaton, @philipbaileynar, and @KellyMWhitehead and I were having regarding calculating gradient and slope a couple of months ago. This might be relevant to your above comment/our conversation from yesterday. Linked above to original discussion, quoted below:
|

|
Thanks @lauren-herbine! This is an interesting approach... @joewheaton do you think this is likely what we're leaning towards for VBET? |

Absolutely. This is what we will be doing in QRiS as well. More to follow in #326 and other places. stay tuned. |


Uh oh!
There was an error while loading. Please reload this page.
Uh oh!
There was an error while loading. Please reload this page.
9-6-21 Making tasks for transfer over to metrics sheet in #395
Global Metrics
These are reported for every sausage link and then summary statistics are reported in dashboard and report
Basic
Area (hectares, sq km, acres, sk mi.)
Landscape Proportion VB (e.g. for a HUC there is 200 km2 of area, and 5% is valley bottom)
Length of transportation network intersecting valley bottom (or specific - road, road type, railroad)
RS Context stuff we have
Not sure if this belongs in RCAT or here because it might not require run-specific parametrization
Geometry
Interactive Tools
The above could be produced as horizontal bar plots for each of the thresholds
Mask Metrics
Using the concept we've described in GCD of AOI vs. Class Masks, to produce same global metrics, but for particular areas of interest, or of polygons of same type (e.g. USFS vs. BLM vs. Private) summaries.
Local (Sausage Link) Metrics
Is actually all above...
All reactions