Week 10 (W05 Feb08) Global Climate Dataset
For our final week, we concentrated all of our data analysis from previous weeks and selectively visualized the conclusions and results in order to obtain an overall understanding of our data, but also estimate the current climate situation (warming from 1960 till today). Our final goal was to predict the temperature 50 years after, in 2067 based on environmental factors. After analysis, correlation and research we concluded that these factors are the emissions, more specifically the greenhouse gases (CO2, nitrous oxide, methane etc). Out of these emissions 50% is emitted to the atmosphere, while rest is absorbed by surface and oceans. Lifetime of each emission type is also estimated and taken into consideration. Through our analysis we found out that the biggest contributors for all types of emissions are USA, China, India, Brazil, Russia, Germany. Based on correlation analysis we also identified the sources of these emissions globally but also for each country separately. In order to predict the temperature based on these emissions, we used a regression model. Based on MSE and relative error the optimal one is the polynomial regression of degree 3 with a rolling window of 4 years. Using this model we predicted the emissions for the biggest contributors and worldwide in 2067. Using these numbers we predicted the temperature rise for 2 case studies (Austria and USA) by employing a neural network. Finally, we predicted the variables that are positively correlated with the emissions.
Global Climate Data (GCD) : Main Dataset
- Number of files: 100.791
- Format: .dly files (Complete Works Wordprocessing Template)
- Size: 26.5 GB
- Features: 46
- Source Date: 1763 - 2016
- Missing values: 43.9%
World Bank (WB) : Complementary Dataset
- Number of files: 1
- Format: .csv
- Size: ~15 MB
- Features: 82
- Source Date: 1960 - 2016
- Missing values: 49.2%
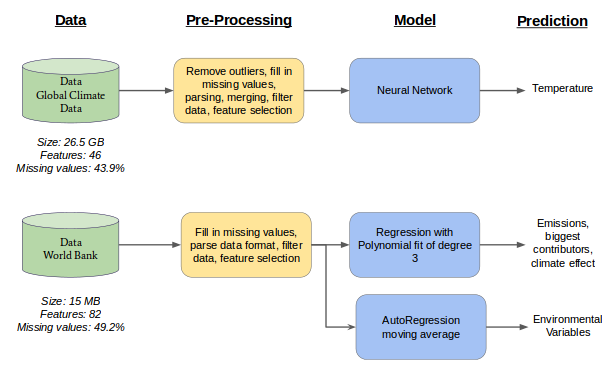
To remind you of work flow we present below a graph showing our procedure and steps from our datasets to the prediction. More details about the steps of Data and Pre-Processing as well as Model are presented in the previous weeks of the wiki. First we start with our 2 main datasets, which we clean them, remove outliers, filter them and select specific features that are in our interest. Then we employ different models for each purpose such as polynomial regression model, auto-regression with moving average and neural network. Our goals are to predict emissions, contributors, effect, sources and most importantly temperature rise.
To see Climate Change (Temperature Rise) globally , we have plotted maps for average temperature (Celsius) for year 1960 and 2016 for all the Countries.


The Maps clearly show the Climate Change (Rise in Temperature)
For Example:
United States (1960) = 11.5 C
United States (2016) = 12.7 C
Russia (1960) = -6 C
Russia (2016) = -2.3 C
Canada (1960) = -4.4 C
Canada (2016) = -1.6 C
Here, individually each country shows different amount of Tavg increase like Russia shows 3.7 degrees, US shows 1.2 degrees, Canada shows 2.8 but globally it has been found out that overall for the entire world temperature rise is around 2 degrees per 100 years. Individual countries may show variation in temperature rise because of external factors affecting that region for example available area, closeness to the water bodies, exposure to pollution level, etc so all countries over the world will not show same temperature rise but globally for the whole world it has been found out that temperature rises around 2 degree in 100 years from available data of past years.

- Northern Hemisphere is warming faster due to heat transport from oceans in the south
Factors Contributing For Temperature Change:
- Greenhouse gases shows positive correlation with Temperature Rise

The Major Released Greenhouse Gasses Globally by percentage

* Major Released Gas is - Carbon Dioxide (CO2) = 51%
Countries contributed abundantly for CO2 is shown below in map and pie chart:

* Major Contributors For CO2 are: China, United States, India, Germany, Russia, Brazil.
Countries contributed abundantly for methane is shown below in map and pie chart

* Major Contributors For Methane are: China, United States, India, Russia.
Countries contributed abundantly for Nitrous Oxide is shown below in Map and Pie Chart

* Major Contributors For Nitrous Oxide are: China, United States, India, Russia.
Sources that affect CO2 emissions
-
First we correlated all the available variables with CO2.The variables which have shown positive correlation
are further grouped into specific variable for example Electricity production from coal and Electricity production from nuclear source are grouped into one variable called Electricity. -
The below mentioned features are major sources for the emission of Co2

Major sources for the emissions Of CO2 is shown in pie charts below

-
China
- Electricity - 52%
- Manufacturing Industries and Construction- 32%
-
India
- Electricity - 40%
- Agriculture - 23%
-
Germany
- Energy - 40 %
- Industry,Agriculture - 32%
-
United States
- Electricity - 50%
- Transportation - 29%
Reasons For the Use of Major Sources For CO2:
-
China :
- 73 percent of Electricity in china is produced using Coal.
- China is a World Manufacturer for example China produces world's 80% of Air conditioners , 70% of mobile
phones.
-
India :
- India is Facing Massive Power Shortage, Around 30 percent of Population still don't have access.
- India has 4th largest reservoir of Coal and produces 66 percent of Electricity from Coal.
-
Germany :
- In 2007, Germany was hugely dependent on Coal, Nuclear for Energy but it has declined the use coal and
invested in renewable Energy but in 2011 Merkel's shuts down 7 nuclear reactor out of 17.
- In 2007, Germany was hugely dependent on Coal, Nuclear for Energy but it has declined the use coal and
-
United States :
- United States Energy sector is largely hold by private companies for example Koch Companies uses abundantly fossil fuels to run Business.
- Climate Change bill didn't pass in United States congress, Because 131 members of Congress denied Climate
Change, From which 38 are senate members, who are also members of American For Prosperity which get highly
funded by Koch Brothers.

Major Sources For The Emission Of Methane is shown in below Pie Charts

-
China
- Coal - 31%
- Agriculture Farming - 26%
-
India
- Coal - 39%
- Agriculture Farming - 32%
-
Germany
- Agriculture Farming - 53 %
- Waste Water Treatment - 22%
-
United States
- Natural Gas and Petroleum - 35%
- Agriculture Farming- 31%
Major Sources For The Emission Of Nitrous Oxide is shown in below Pie Charts

-
India
- Transport - 69%
-
Germany
- Transport - 53 %
-
United States
- Agriculture Soil Management - 84%
- We assume a worst-case scenario in our predictions
- For emissions we take into consideration the biggest contributors and a 20% of the global emissions
- Emissions affect locations uniformly (no distance factor taken into account)
- 50% of emissions travel in the atmosphere, rest is absorbed
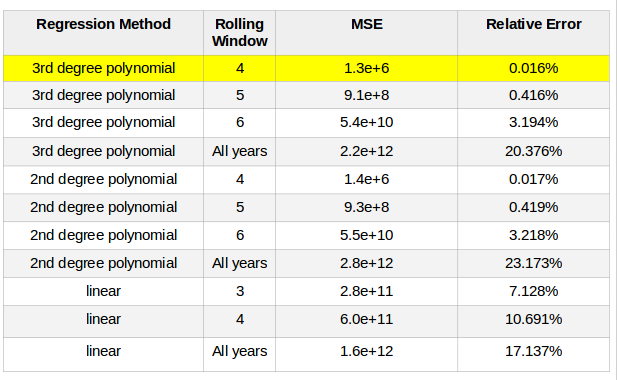
In order to estimate the emissions in the future, more specifically in 2067 we tried several regressions methods with various windows. The optimal one for most cases proved to be the polynomial regression with a rolling window of 4 years. The only exception was the case of Brazil where emissions responded better to a linear fit with rolling window of 3 years. The methods tested along with their MSE and relative error are presented in the table below:
Using the specific method we predicted the total amount of each emission type for the biggest contributors, but also globally. The global trend of emissions is shown in the following graphs. We notice that there is an almost exponential growth of the emissions. From 1960 to 2016 it is the real data and from 2017 and on it is the predicted values.
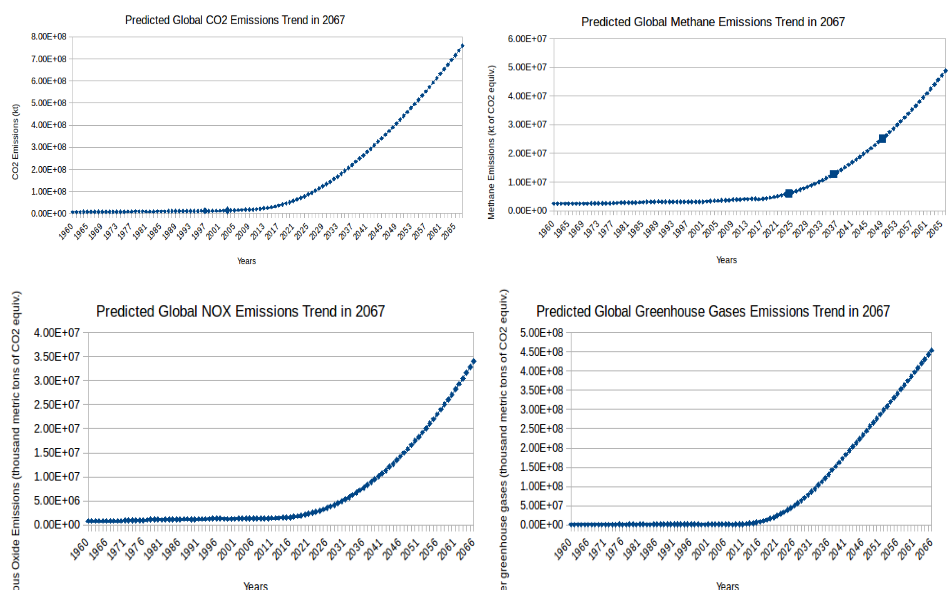
In numbers for 2067:
- Carbon dioxide (kt): 760210493
- Methane (thousand metric tons of CO2 equiv.): 48888139
- Nitrous oxide (kt of CO2 equiv.): 34030479
- Greenhouse gas emissions (thousand metric tons of CO2 equiv.): 454203705
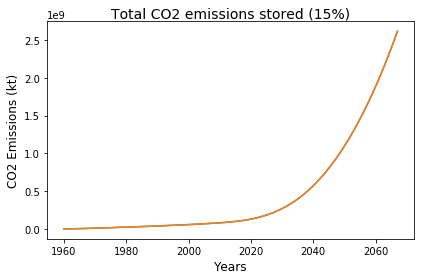
What is also important and taken into account to estimate the future emissions and their contribution to temperature rise is their lifetime. We concluded to the following lifetimes after searching through the literature:
* Carbon dioxide: ~ 110 years (hundreds of thousands of years for a 15% of it) * Nitrous Oxide: ~ 114 years * Methane: ~ 12 years * SF6: ~ 3000 years * HFC: ~ 260 years * PFC: ~ 116 yearsAccording to these findings, we estimated the stored carbon dioxide (15%) at every year's emissions and accumulated till 2067. The total amount of Carbon Dioxide that will be taking thousands of years to dissolve in the atmosphere will 2.6e+09 kt by 2067. This amount is 2.8 times bigger than the total actual emissions from 1960 till today. So it is shocking to see what this huge number of emissions could do in the future. The graph below shows the trend of the accumulated 15% of carbon dioxide and every years emissions:
In addition to the findings above, we were interested in determining a timeframe for the cause-effect of emissions and temperature rise. We were able to find a positive correlation between them. However it is hard to tell when the emissions emitted at a specific year will start affecting the climate. Based on literature this timeframe is estimated to 40 years. Thus, the climate change we feel today is a result of the conditions till 1977. In 2067 we will feel the effect of emissions till 2027. We decided to quantify this effect to understand better the magnitude. Carbon dioxide emissions will be 128 times larger, nitrous oxide 48 times larger and other greenhouse gasses 487 times larger by 2027. Today we have an average warming of 1-2 degrees Celsius. Imagine what could happen in 2067 with such a big rise in emissions.
In order to predict various environmental variables over the years we tested the following two methods.
- Auto-Regression
- Auto-Regression Moving Average [Details-https://en.wikipedia.org/wiki/Autoregressive%E2%80%93moving-average_model]
The errors we got are shown below. We chose the Auto-Regression with moving average for our purpose due to the lower error.
.jpg)
We aggregated the variables from the following countries to estimate the global impact. (total countries included 115/196): Angola Albania United Arab Emirates Argentina Armenia Australia Austria Azerbaijan Belgium Benin Bangladesh Bulgaria Bahrain Bosnia and Herzegovina Belarus Bolivia Brazil Brunei Darussalam Botswana Canada Switzerland Chile China Cote d'Ivoire Cameroon Congo, Rep. Colombia Costa Rica Cuba Cyprus Czech Republic Germany Denmark Dominican Republic Algeria Ecuador Egypt, Arab Rep. Eritrea Spain Estonia Ethiopia Finland France Gabon United Kingdom Georgia Ghana Gibraltar Greece Guatemala Hong Kong SAR, China Honduras Croatia Haiti Hungary Indonesia India Ireland Iran, Islamic Rep. Iraq Iceland Israel Italy Jamaica Jordan Japan Kazakhstan Kenya Kyrgyz Republic Cambodia Korea, Rep. Kuwait Lebanon Libya Sri Lanka Lithuania Luxembourg Latvia Morocco Moldova Mexico Macedonia, FYR Malta Myanmar Mongolia Mozambique Malaysia Namibia Nigeria Nicaragua Netherlands Norway Nepal New Zealand Oman Pakistan Panama Peru Philippines Poland Korea, Dem. People’s Rep. Portugal Paraguay Qatar Romania Russian Federation Saudi Arabia Sudan Senegal Singapore El Salvador Slovak Republic Slovenia Sweden Syrian Arab Republic Togo Thailand Tajikistan Turkmenistan Trinidad and Tobago Tunisia Turkey Tanzania Ukraine Uruguay United States Uzbekistan Venezuela, RB Vietnam Yemen, Rep. South Africa Congo, Dem. Rep. Zambia Zimbabwe
We have tried to take these 115 countries instead of 196 because they are the major contributors to the impact of these variables on emissions over the years. What we see in these graphs is that variable such as Energy consumption (through non-renewable sources) is rising over the predicted years exponentially, which shows an alarming situation as it may proclaim heavy dependence on non-renewable sources and emissions of greenhouse gases.
We tried prediction similarly for other variables such as population, Forested area, Agriculture, and got similar results contributing to an increase in emissions in worst case scenario. Usually, big countries like China, USA (main emission contributor) showed an increase in population over the years except India which showed a bit decline. Other developed European countries and east Asian countries (Japan, South Korea) showed decline in the population over the years. For Agriculture too USA, Germany, India showed increase in Agriculture contribution compared to other countries.
About the forested area variable most countries showed increase in forestration except India and USA.

Our results are based on our model used and shows that some are physically correct, but some others show that our results do not match to the common expectation. The misinterpreted results is most likely due to our models mechanics. We notice the importance of trying to research and understand the findings of data analysis in order to conclude about the efficiency of our model.
An important prediction goal for us is to predict the temperature based on environmental variables, most specifically the emissions over the years. This proved to be really complex because of concept drift and the wide number of unpredictable factors. However we attempted the following methods and got satisfactory results with our neural network.
-
PLSR (Principal Least Square Regression Method) [Description: https://en.wikipedia.org/wiki/Partial_least_squares_regression]
-
PCR (Principal component Regression) [Description: https://en.wikipedia.org/wiki/Principal_component_regression]
-
Neural Network
X(t): Input Matrix > Emissions y(t): Target > Temperature Algorithm used for Training: Levenberg Marquardt Number of hidden neurons: 10 Number of Delays: 2
The errors are shown in the following table:
.jpg)
Our real data are from 1960 to 2016, while the predicted ones after 2017. In the following graphs we present the results for two case studies, Austria and USA.
Average temperature rise in Austria

Average temperature rise in USA

So here we tried to show how the country like Austria with much less emissions can be the major target of temperature rise and also country like USA, a major contributor to emissions can itself be affected by it, emphasizing the global effect of climate warming. The average temperature rise of Austria calculated from the predictions (2017-2067) is 0.83 Celsius and average temperature rise in USA calculated from predictions (2017-2067) is 0.68. Based on our analysis in previous sections, we estimated an average warming of 2-3 degrees Celsius every 100 years. With our model results we receive a bit less than 1-degree rise in 50 years, which would translate into 1-2 degrees every 100 years. This number is smaller than our expectation but still manages to show a continuous increase of the temperature. Improvements in our neural network, as well as the prediction of emissions could be made to improve the accuracy of the model. Such improvements would be the employment of different more detailed neural network algorithms, that are more time-consuming though.
-
Temperature rise is not taking place locally, but globally. Even if specific countries do not emit high amounts of emissions their temperature is equally affected by global emissions. [case studies: both Austria and USA are affected]
-
Northern Hemisphere is warming faster due to heat transport from oceans in the south
-
Warming of the planet is already apparent | 2-3 degrees Celsius on average per century
-
The biggest countries with high development contribute most to the climate change
-
CO2 is the major contributing factor
-
There is a positive correlation between emissions and temperature rise
-
There is also a positive correlation between emissions and some other environmental variables, implying the reasons behind their increase
-
Emissions are rising and so will the temperature (40 years cause-effect)
-
We predicted temperature rise of 1 degree Celsius on average by 2067
-
Predicting temperature in the future based on environmental and climate factors is complex and rather theoretical due to the unpredictable cause-effect and concept drift phenomenon
https://docs.google.com/presentation/d/1Oa9Ndtjd9ca7AzX3M_u1KBwyLaVx-AA5h8u7gwU2Ywg/edit?usp=sharing
- Menne, M.J., I. Durre, R.S. Vose, B.E. Gleason, and T.G. Houston, 2012: An overview of the Global Historical Climatology Network-Daily Database. Journal of Atmospheric and Oceanic Technology, 29, 897-910, doi:10.1175/JTECH-D-11-00103.1.
- Menne, M.J., I. Durre, B. Korzeniewski, S. McNeal, K. Thomas, X. Yin, S. Anthony, R. Ray, R.S. Vose, B.E.Gleason, and T.G. Houston, 2012: Global Historical Climatology Network - Daily (GHCN-Daily), Version 3. [indicate subset used following decimal, e.g. Version 3.12]. NOAA National Climatic Data Center. http://doi.org/10.7289/V5D21VHZ
- WB Dataset - http://data.worldbank.org
- Correlation Analysis - http://sphweb.bumc.bu.edu/otlt/MPH-Modules/BS/BS704_Multivariable/BS704_Multivariable5.html
- Climate change impacts on Austrian ski areas, Robert Steiger & Bruno Abegg (Link)
- HFCs? Curbing Them Is Key to Climate-Change Strategy (Op-Ed), Hallie Kennan, Energy Innovation: Policy and Technology (Link)
- How do we know more CO2 is causing warming? (Link)
- Effects of Global Warming [livescience.com]
- Living Warmer: How 2 Degrees Will Change Earth [livescience.com]
- In Warming, Northern Hemisphere is Outpacing the South [climatecentral.org]
- Climate Change: The 40 Year Delay Between Cause and Effect Posted on 22 September 2010 by alan_marshall [climatechangeanswers.org]
- How long do greenhouse gases stay in the air? [theguardian.com]