Week 10 (W05 Feb08) Global Climate Dataset
For our final week, we concentrated all of our data analysis from previous weeks and selectively visualized the conclusions and results in order to obtain an overall understanding of our data, but also estimate the current climate situation (warming from 1960 till today). Our final goal was to predict the temperature 50 years after, in 2067 based on environmental factors. After analysis, correlation and research we concluded that these factors are the emissions, more specifically the greenhouse gases (CO2, nitrous oxide, methane etc). Out of these emissions 50% is emitted to the atmosphere, while rest is absorbed by surface and oceans. Lifetime of each emission type is also estimated and taken into consideration. Through our analysis we found out that the biggest contributors for all types of emissions are USA, China, India, Brazil, Russia, Germany. Based on correlation analysis we also identified the sources of these emissions globally but also for each country separately. In order to predict the temperature based on these emissions, we used a regression model. Based on MSE and relative error the optimal one is the polynomial regression of degree 3 with a rolling window of 4 years. Using this model we predicted the emissions for the biggest contributors and worldwide in 2067. Using these numbers we predicted the temperature rise for 2 case studies (Austria and USA) by employing a neural network. Finally, we predicted the variables that are positively correlated with the emissions.
Global Climate Data (GCD) : Main Dataset
- Number of files: 100.791
- Format: .dly files (Complete Works Wordprocessing Template)
- Size: 26.5 GB
- Features: 46
- Source Date: 1763 - 2016
- Missing values: 43.9%
World Bank (WB) : Complementary Dataset
- Number of files: 1
- Format: .csv
- Size: ~15 MB
- Features: 82
- Source Date: 1960 - 2016
- Missing values: 49.2%
- We assume a worst-case scenario in our predictions
- For emissions we take into consideration the biggest contributors and a 20% of the global emissions
- Emissions affect locations uniformly (no distance factor taken into account)
- 50% of emissions travel in the atmosphere, rest is absorbed
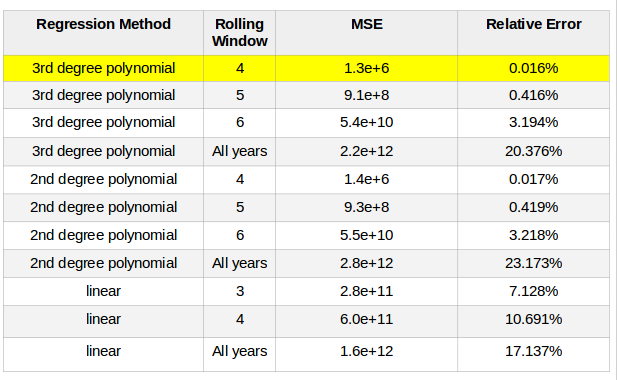
In order to estimate the emissions in the future, more specifically in 2067 we tried several regressions methods with various windows. The optimal one for most cases proved to be the polynomial regression with a rolling window of 4 years. The only exception was the case of Brazil where emissions responded better to a linear fit with rolling window of 3 years. The methods tested along with their MSE and relative error are presented in the table below:
Using the specific method we predicted the total amount of each emission type for the biggest contributors, but also globally. The global trend of emissions is shown in the following graphs. We notice that there is an almost exponential growth of the emissions. From 1960 to 2016 it is the real data and from 2017 and on it is the predicted values.
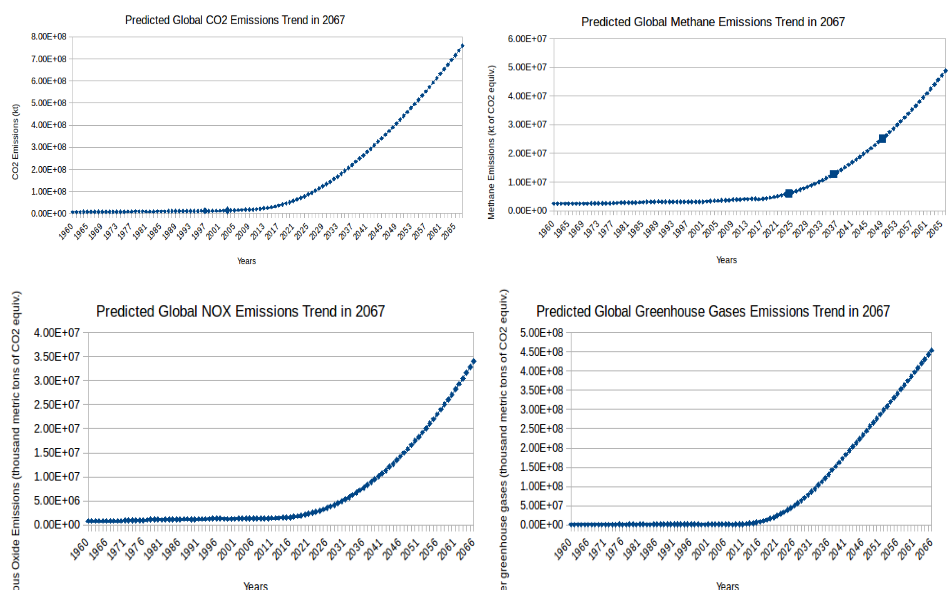
In numbers for 2067: Carbon dioxide (kt): 760210493 Methane (thousand metric tons of CO2 equiv.): 48888139 Nitrous oxide (kt of CO2 equiv.): 34030479 Greenhouse gas emissions (thousand metric tons of CO2 equiv.): 454203705
**Regression Methods used**
- PLSR(Principal Least Square Regression Method)
Description- Visit the link
https://en.wikipedia.org/wiki/Partial_least_squares_regression
- PCR(Principal component Regression **
Description->visit the link
https://en.wikipedia.org/wiki/Principal_component_regression
- Neural Network
X(t): Input Matrix > Emissions
y(t): Target > Temperature
Algorithm used for Training: Levenberg Marquardt
Number of hidden neurons: 10
Number of Delays: 2
Errors in methodology used
.jpg)
Tavg rise in Austria

Tavg rise in USA
-
Temperature rise is not taking place locally, but globally. Even if specific countries do not emit high amounts of emissions their temperature is equally affected by global emissions. [case studies: both Austria and USA are affected]
-
Northern Hemisphere is warming faster due to heat transport from oceans in the south
-
Warming of the planet is already apparent | 2-3 degrees Celsius on average per century
-
The biggest countries with high development contribute most to the climate change
-
CO2 is the major contributing factor
-
There is a positive correlation between emissions and temperature rise
-
There is also a positive correlation between emissions and some other environmental variables, implying the reasons behind their increase
-
Emissions are rising and so will the temperature (40 years cause-effect)
-
We predicted temperature rise of 1 degree Celsius on average by 2067
-
Predicting temperature in the future based on environmental and climate factors is complex and rather theoretical due to the unpredictable cause-effect and concept drift phenomenon
https://docs.google.com/presentation/d/1Oa9Ndtjd9ca7AzX3M_u1KBwyLaVx-AA5h8u7gwU2Ywg/edit?usp=sharing
- Menne, M.J., I. Durre, R.S. Vose, B.E. Gleason, and T.G. Houston, 2012: An overview of the Global Historical Climatology Network-Daily Database. Journal of Atmospheric and Oceanic Technology, 29, 897-910, doi:10.1175/JTECH-D-11-00103.1.
- Menne, M.J., I. Durre, B. Korzeniewski, S. McNeal, K. Thomas, X. Yin, S. Anthony, R. Ray, R.S. Vose, B.E.Gleason, and T.G. Houston, 2012: Global Historical Climatology Network - Daily (GHCN-Daily), Version 3. [indicate subset used following decimal, e.g. Version 3.12]. NOAA National Climatic Data Center. http://doi.org/10.7289/V5D21VHZ
- WB Dataset - http://data.worldbank.org
- Correlation Analysis - http://sphweb.bumc.bu.edu/otlt/MPH-Modules/BS/BS704_Multivariable/BS704_Multivariable5.html
- Climate change impacts on Austrian ski areas, Robert Steiger & Bruno Abegg (Link)
- HFCs? Curbing Them Is Key to Climate-Change Strategy (Op-Ed), Hallie Kennan, Energy Innovation: Policy and Technology (Link)
- How do we know more CO2 is causing warming? (Link)
- Effects of Global Warming [livescience.com]
- Living Warmer: How 2 Degrees Will Change Earth [livescience.com]
- In Warming, Northern Hemisphere is Outpacing the South [climatecentral.org]
- Climate Change: The 40 Year Delay Between Cause and Effect Posted on 22 September 2010 by alan_marshall [climatechangeanswers.org]
- How long do greenhouse gases stay in the air? [theguardian.com]