Dataset about Supply Chain used for Analytics and finding insights using Data Visualization
Complete Analysis and Visualization can be seen here: https://public.tableau.com/app/profile/shwetank.rokade/viz/DataCoSupplyChainAnalytics/Overall
Dataset can be downloaded here: https://www.kaggle.com/shashwatwork/dataco-smart-supply-chain-for-big-data-analysis?select=DescriptionDataCoSupplyChain.csv
Dataset is about various supply chains across the world. Data contains Products Ordered, Their Sales, Region, Profit, Loss, Categories of Products etc.
Task is to perform track of Sales, Profit, Orders, Customers and Products by analyzing them
1: Track Products: Products with Highest/Lowest Sold, Products with Highest/Lowest Profit with Filters and Parameter.
2: Track Sales: Region Wise Sales, Profitable States and Non Profitable States for selling products with Filters and Parameter.
3: Track Product Category: Top/ Bottom Product Categories for Different Markets Sales, Profit and Loss States for Product Categories with Filters anmd Parameter
4: Track Delivery and Orders: Track Delivery Status across various regions, Order Status across regions, various Shipping Modes for Delivery
5: Track Overall Performance: Track Sales and Profit Overall throughtout the years
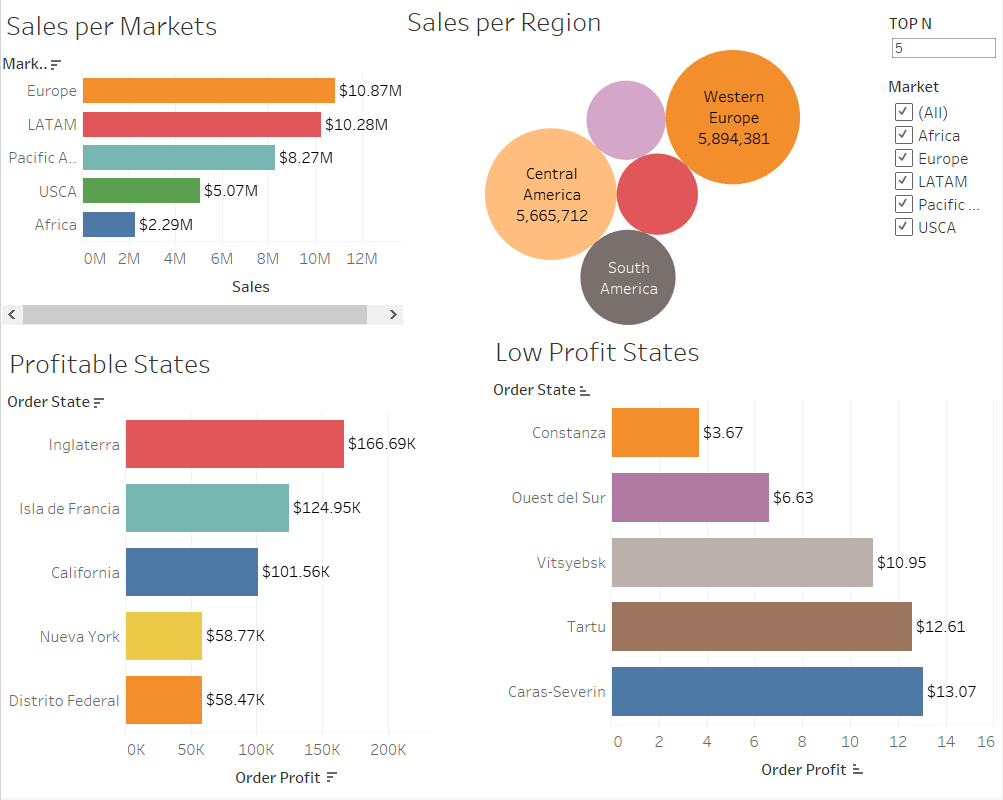
Top Left: Europe and LATAM have largest Sales of $10.8M and $10.28M respectively
Top Right: Western Europe and Central America have largest Sales per region
Bottom Left: Inglaterra (England),Isla de Francia (Region in France surrounds Paris) are most Profitable States in terms of Selling Products
Bottom right: Constanza(region in Domincian Republician) is the lowest profitable states
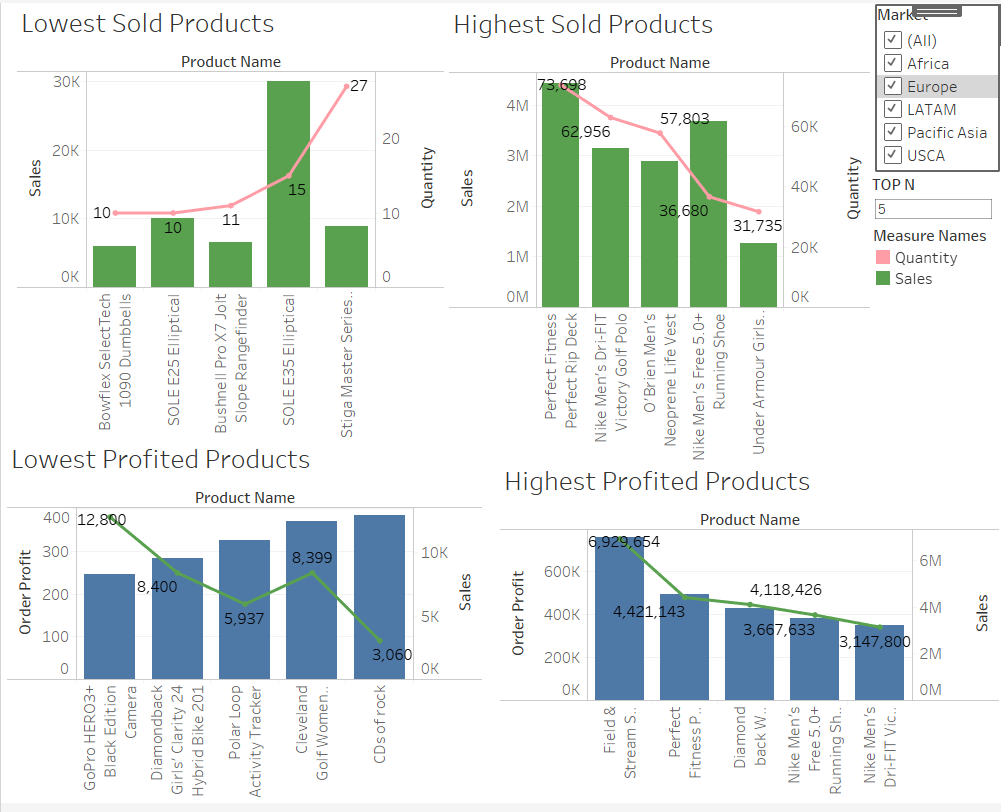
Top Left: Dumbells, SOLE Elliptical(Exercise Cycle) are the lowest selling products
Top Right: Perfect Rip Deck (Gym Equipment) and Nike Golf Polo Shirt are the most popular selling products
Bottom Left: Go Pro Camera and Hybrid Bike are lowest Profited Products with Profit 250 and 290 $ only
Bottom Right: Field and Stream Gun Safe, Perfect Fitness Rip Deck with profit of 6.9 M and 4.4 M respectively

Top Viz: Sales of products over quarters sales are increasing till 2017 Q3 but 2017 Q4 the sales were declining
Profit of products were increasing till 2015 Q3 and then there was decline for profit for 2015Q4 and 2016 Q1 and there profit was increasing and at the end in 2017Q4 profit drop again
Fishing and Cleats are the most popular Product Categories for Sales
Most of Orders were Completed Successfully while some are in pending and Processing stages
Majority of orders where delivered late

Top left: Strength Training and CDs are the least profited Product categories
Top Right: Fishing and Cleats are most popular products category for profits
Top Product categories Sales distribution over various Markets
Bottom Product Categories Sales distribution over various markets
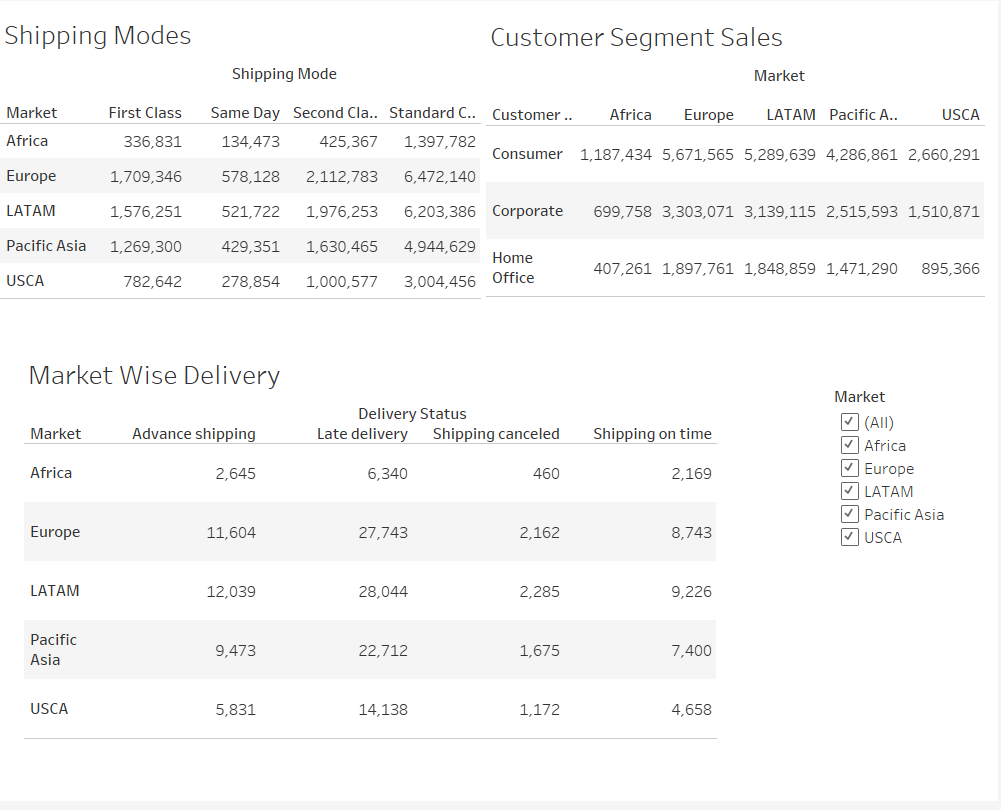
Top Left: Sales for various Markets over different delivery shipping modes where majority of Sales were in Europe, LATAM and Pacific Asia
Top Right: Sales for different Customer Segments over different Markets where most Sales are made by Consumer
Count of Different Delivery Status over different markets where Europe, LATAM and pacific Asia were most having most orders
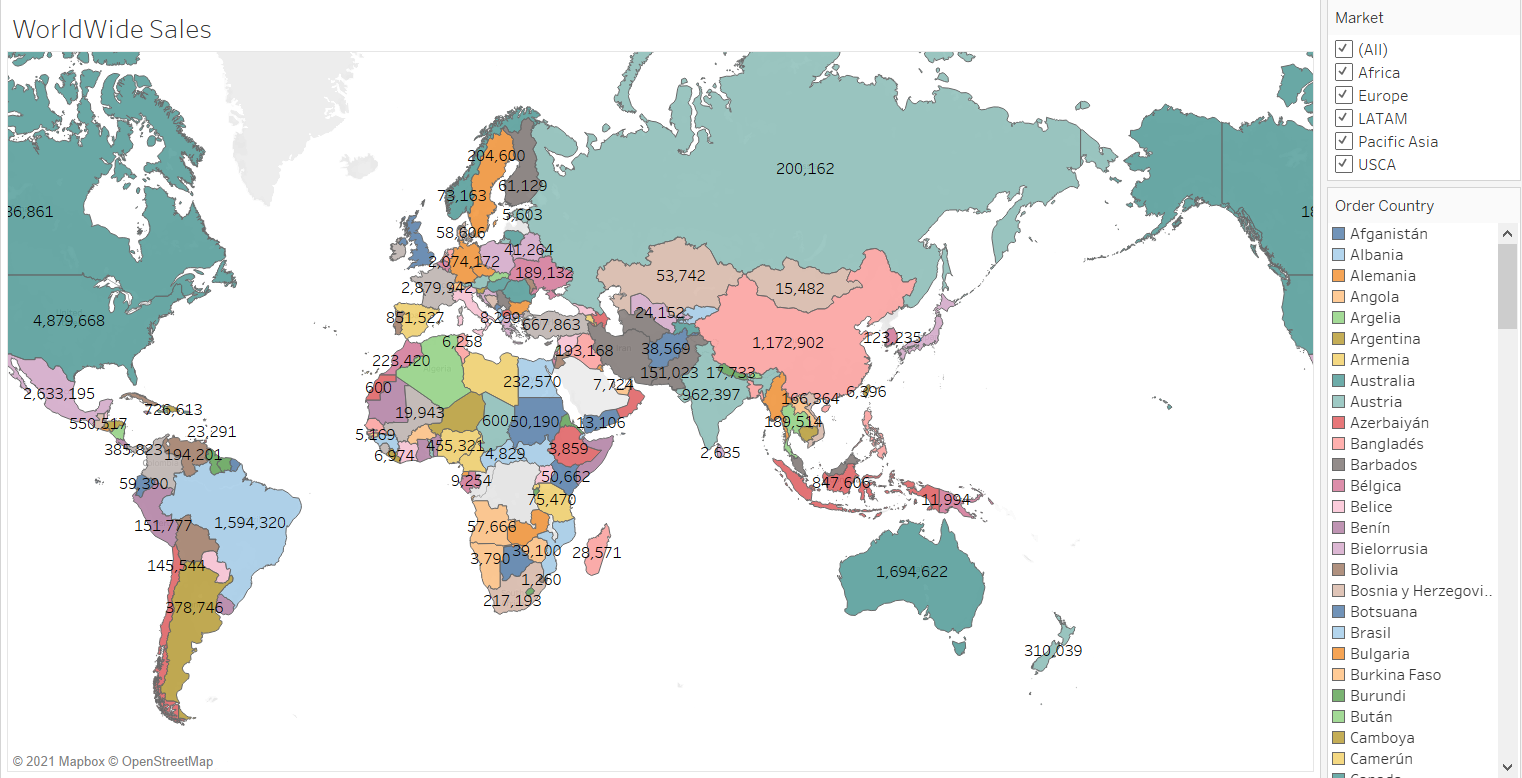
Geographical graph of Distribution of Sales over each countries where Alemania, France, Italy, USA, Brazil, Mexico and Australia are having highest sales