Repository navigation
The Dashboard
Device Sentinel puts one page in your Home Assistant sidebar, called Device Sentinel. It gathers what the integration knows about your house into tabs you can read, sort and click through, instead of files you have to open one by one.
Only administrators see it. If you share Home Assistant with people who shouldn't be looking at your battery levels, they won't find it in their sidebar. If you'd rather not see it in yours, hide it the way you hide any sidebar item, from your Home Assistant profile.
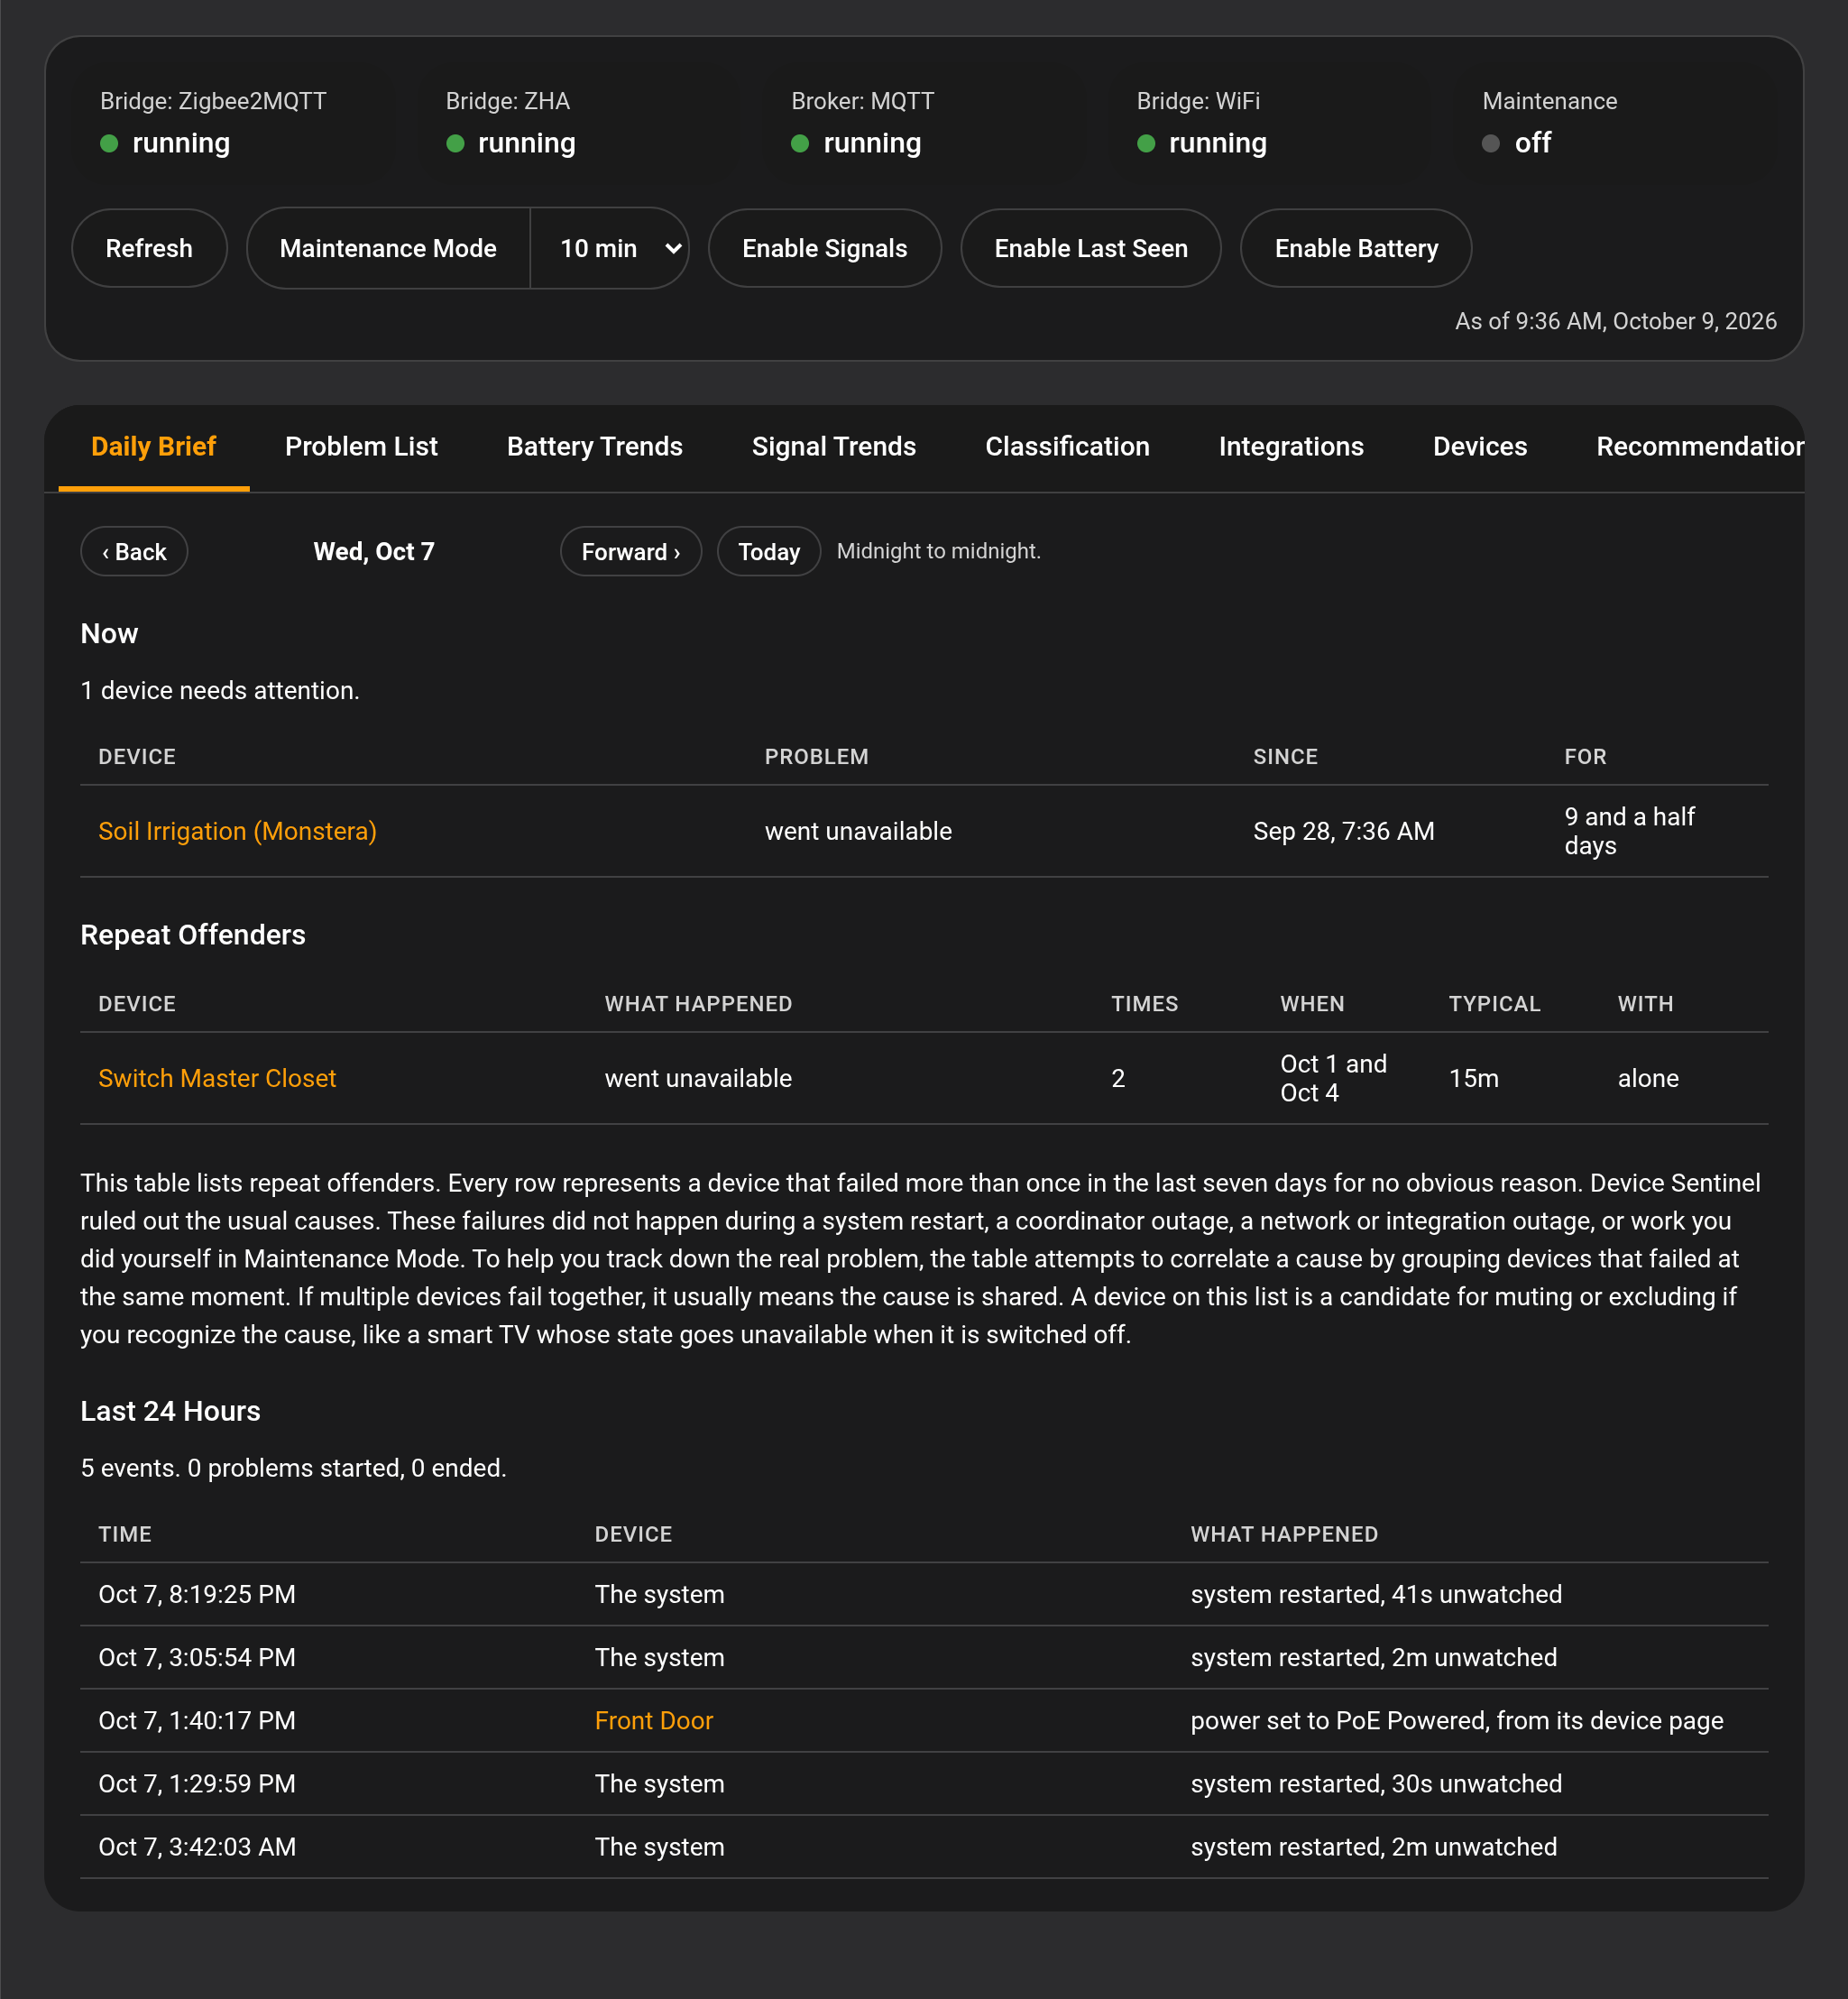
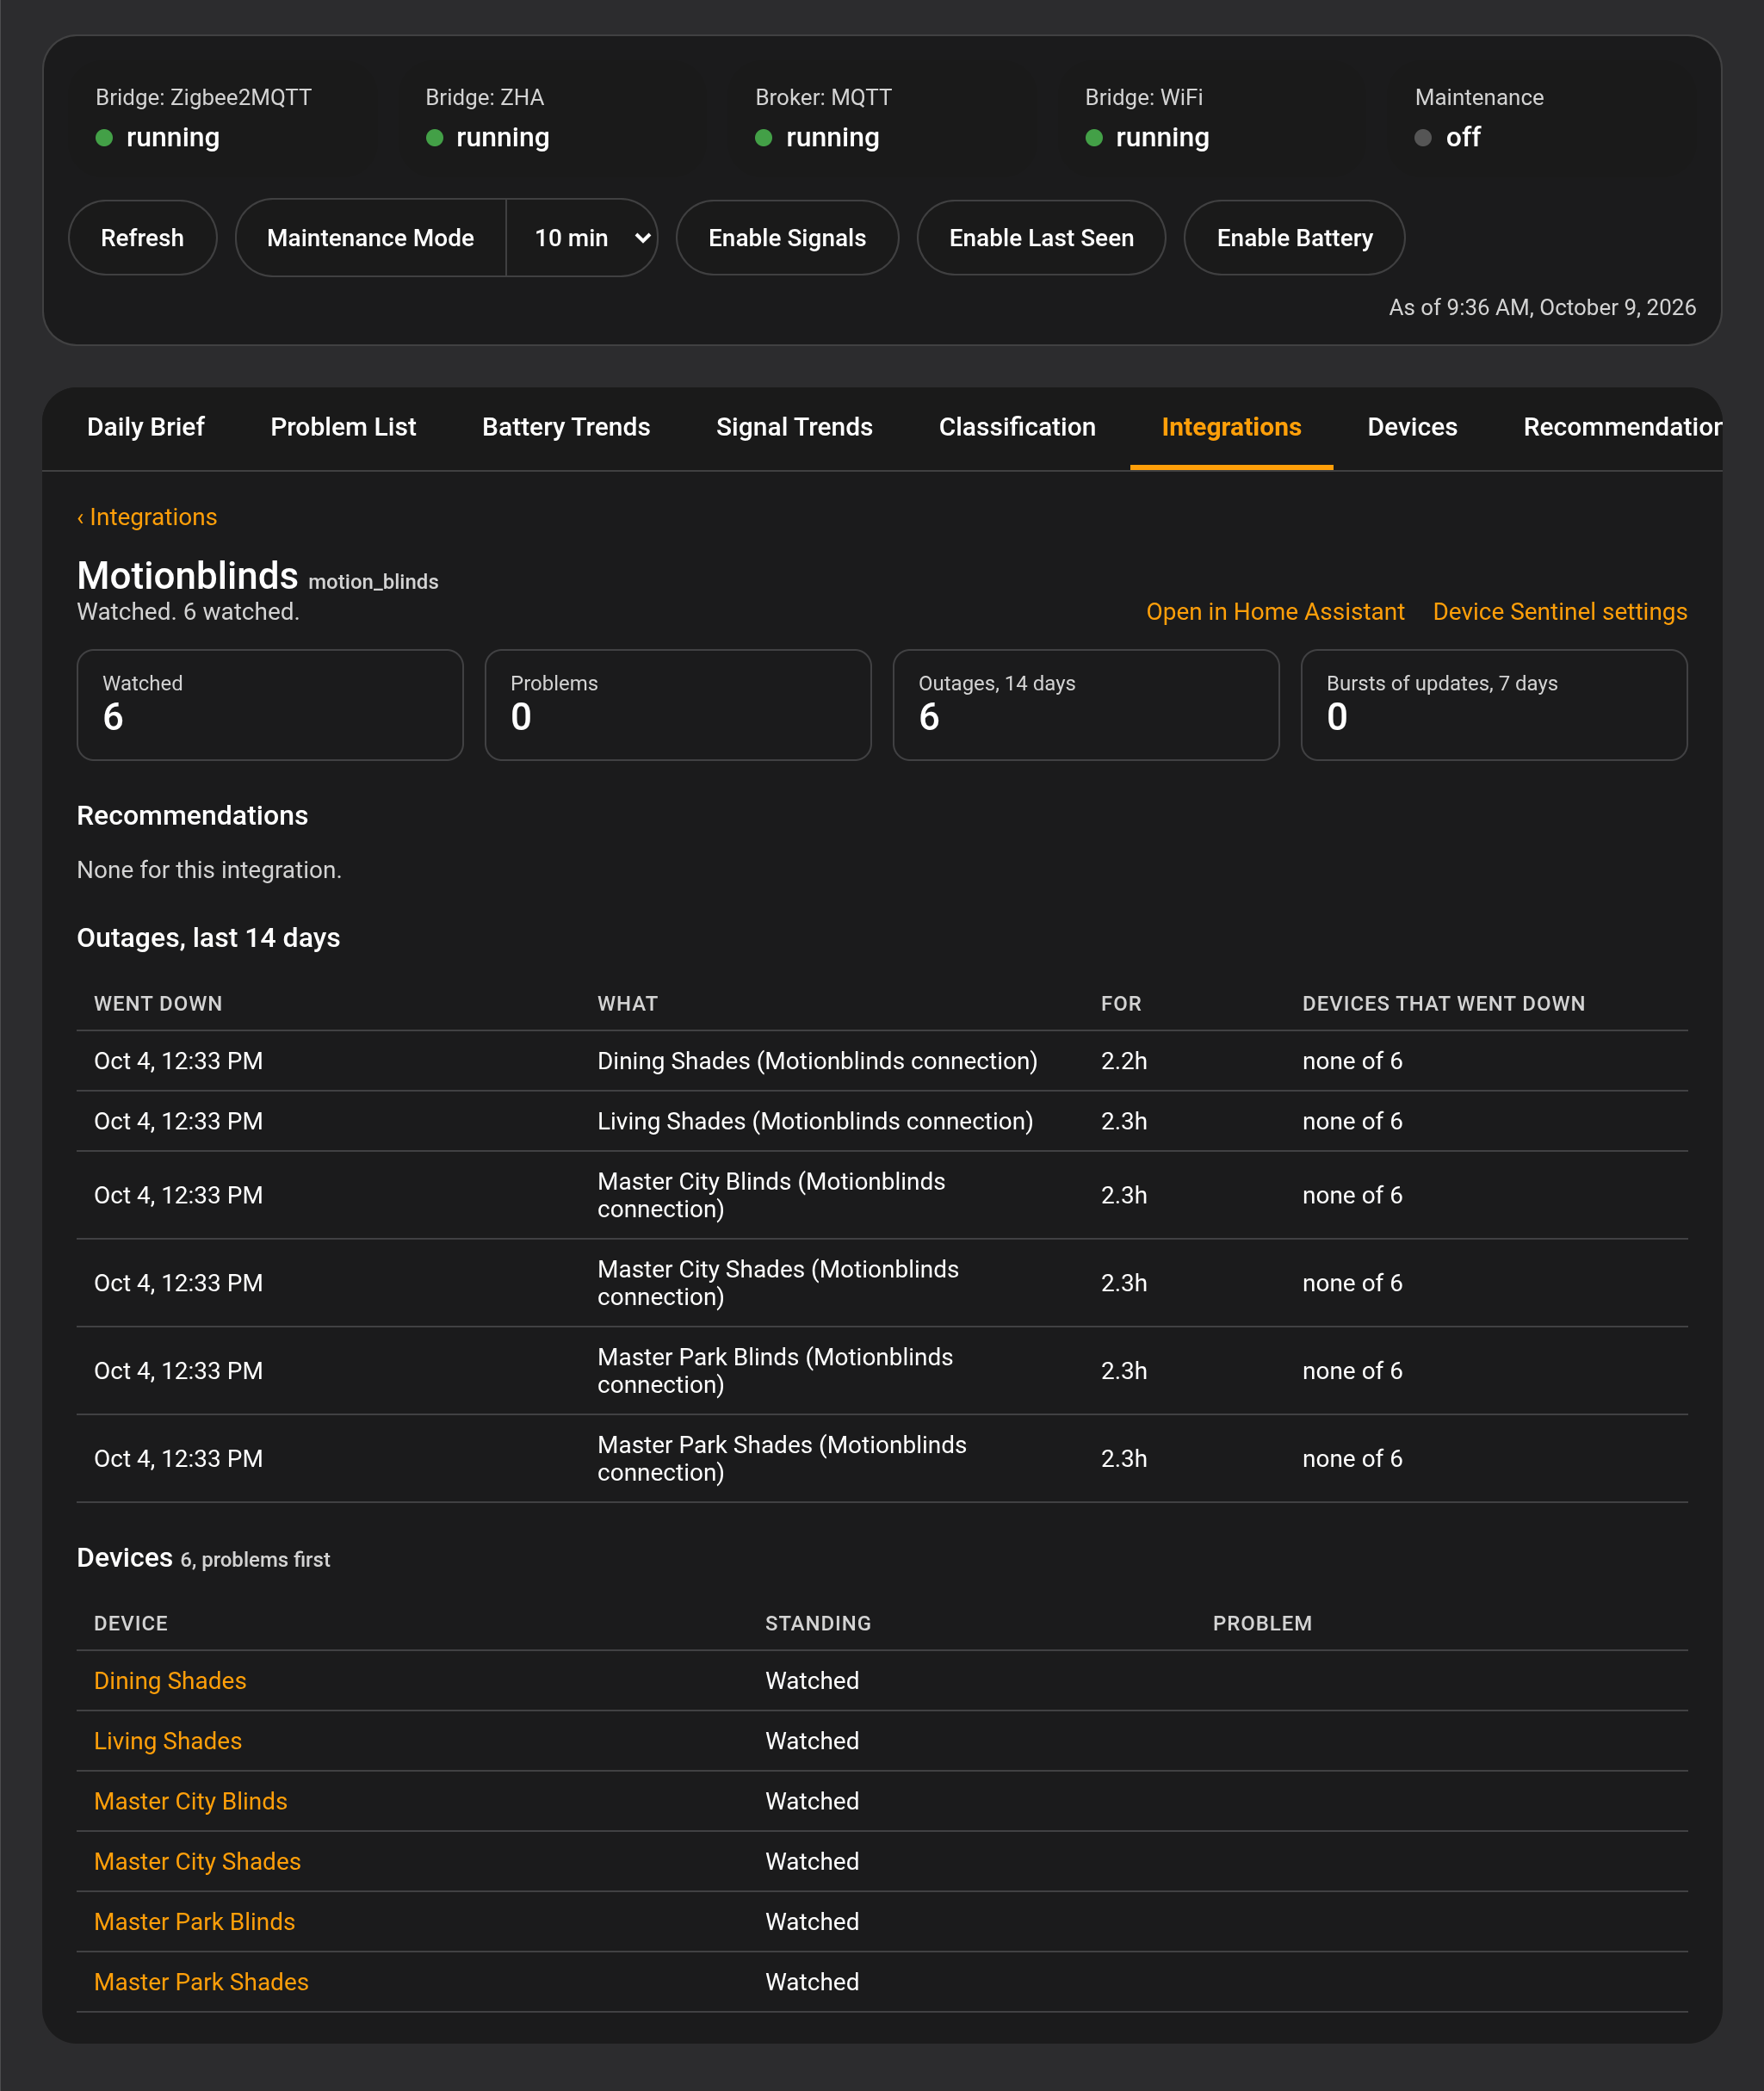
Across the top sit a few status boxes, one for each coordinator, broker or network your house actually has: the Zigbee2MQTT bridge, the ZHA bridge, the MQTT broker, your Wi-Fi network, and Maintenance. A house without ZHA never sees a ZHA box. The Bridge and Broker Sensors explains what each state means.
Beneath them is a row of buttons:
- Refresh brings the tabs up to date. The dashboard is a snapshot, taken when you open it, so nothing shifts under your eyes while you read. When something worth seeing has happened since, like a problem opening or closing, an outage or a restart, or a new day's figures after midnight, the button changes color.
- Maintenance Mode opens a maintenance window for as many minutes as the picker beside it says, from 5 to 60. It starts at your configured default. While the window is open, the button ends it early.
- Enable Signals, Enable Last Seen and Enable Battery turn on the disabled entities Device Sentinel reads, the same three buttons as on The Device Page.
On the right, the page tells you when its figures were taken. The printer icon prints the tab or page on screen in light colors, whatever your theme, and your browser's print dialog can save it as a PDF instead. The gear opens Device Sentinel's settings.
The dashboard opens on the Daily Brief. Each tab has its own address, so your browser's Back button works and you can bookmark the one you check most.
Daily Brief. The daily brief laid out for the screen, one calendar day at a time, midnight to midnight. Step back a day or forward a day, or jump to Today, as far back as fourteen days. Today's list of standing problems carries a checkbox, so you can acknowledge a problem right where you read about it. Past days are rebuilt from the record, and the Repeat Offenders section looks back seven days from whichever day you are viewing.
Problem List. Everything on the problem list, worst first, acknowledged items included. Filter by All, Open or Acknowledged, and sort by device, integration or how long the problem has stood. A battery problem names the battery the device takes, such as "battery 12%, 2× CR2032", and a Zigbee2MQTT device's integration reads Zigbee2MQTT. Beside each problem sits the mute that matches it: Mute freeze, Mute battery or Mute signal. A muted item leaves the list quietly, with no recovery announced. Ticking a box here is exactly the same as ticking it in the To-do list.
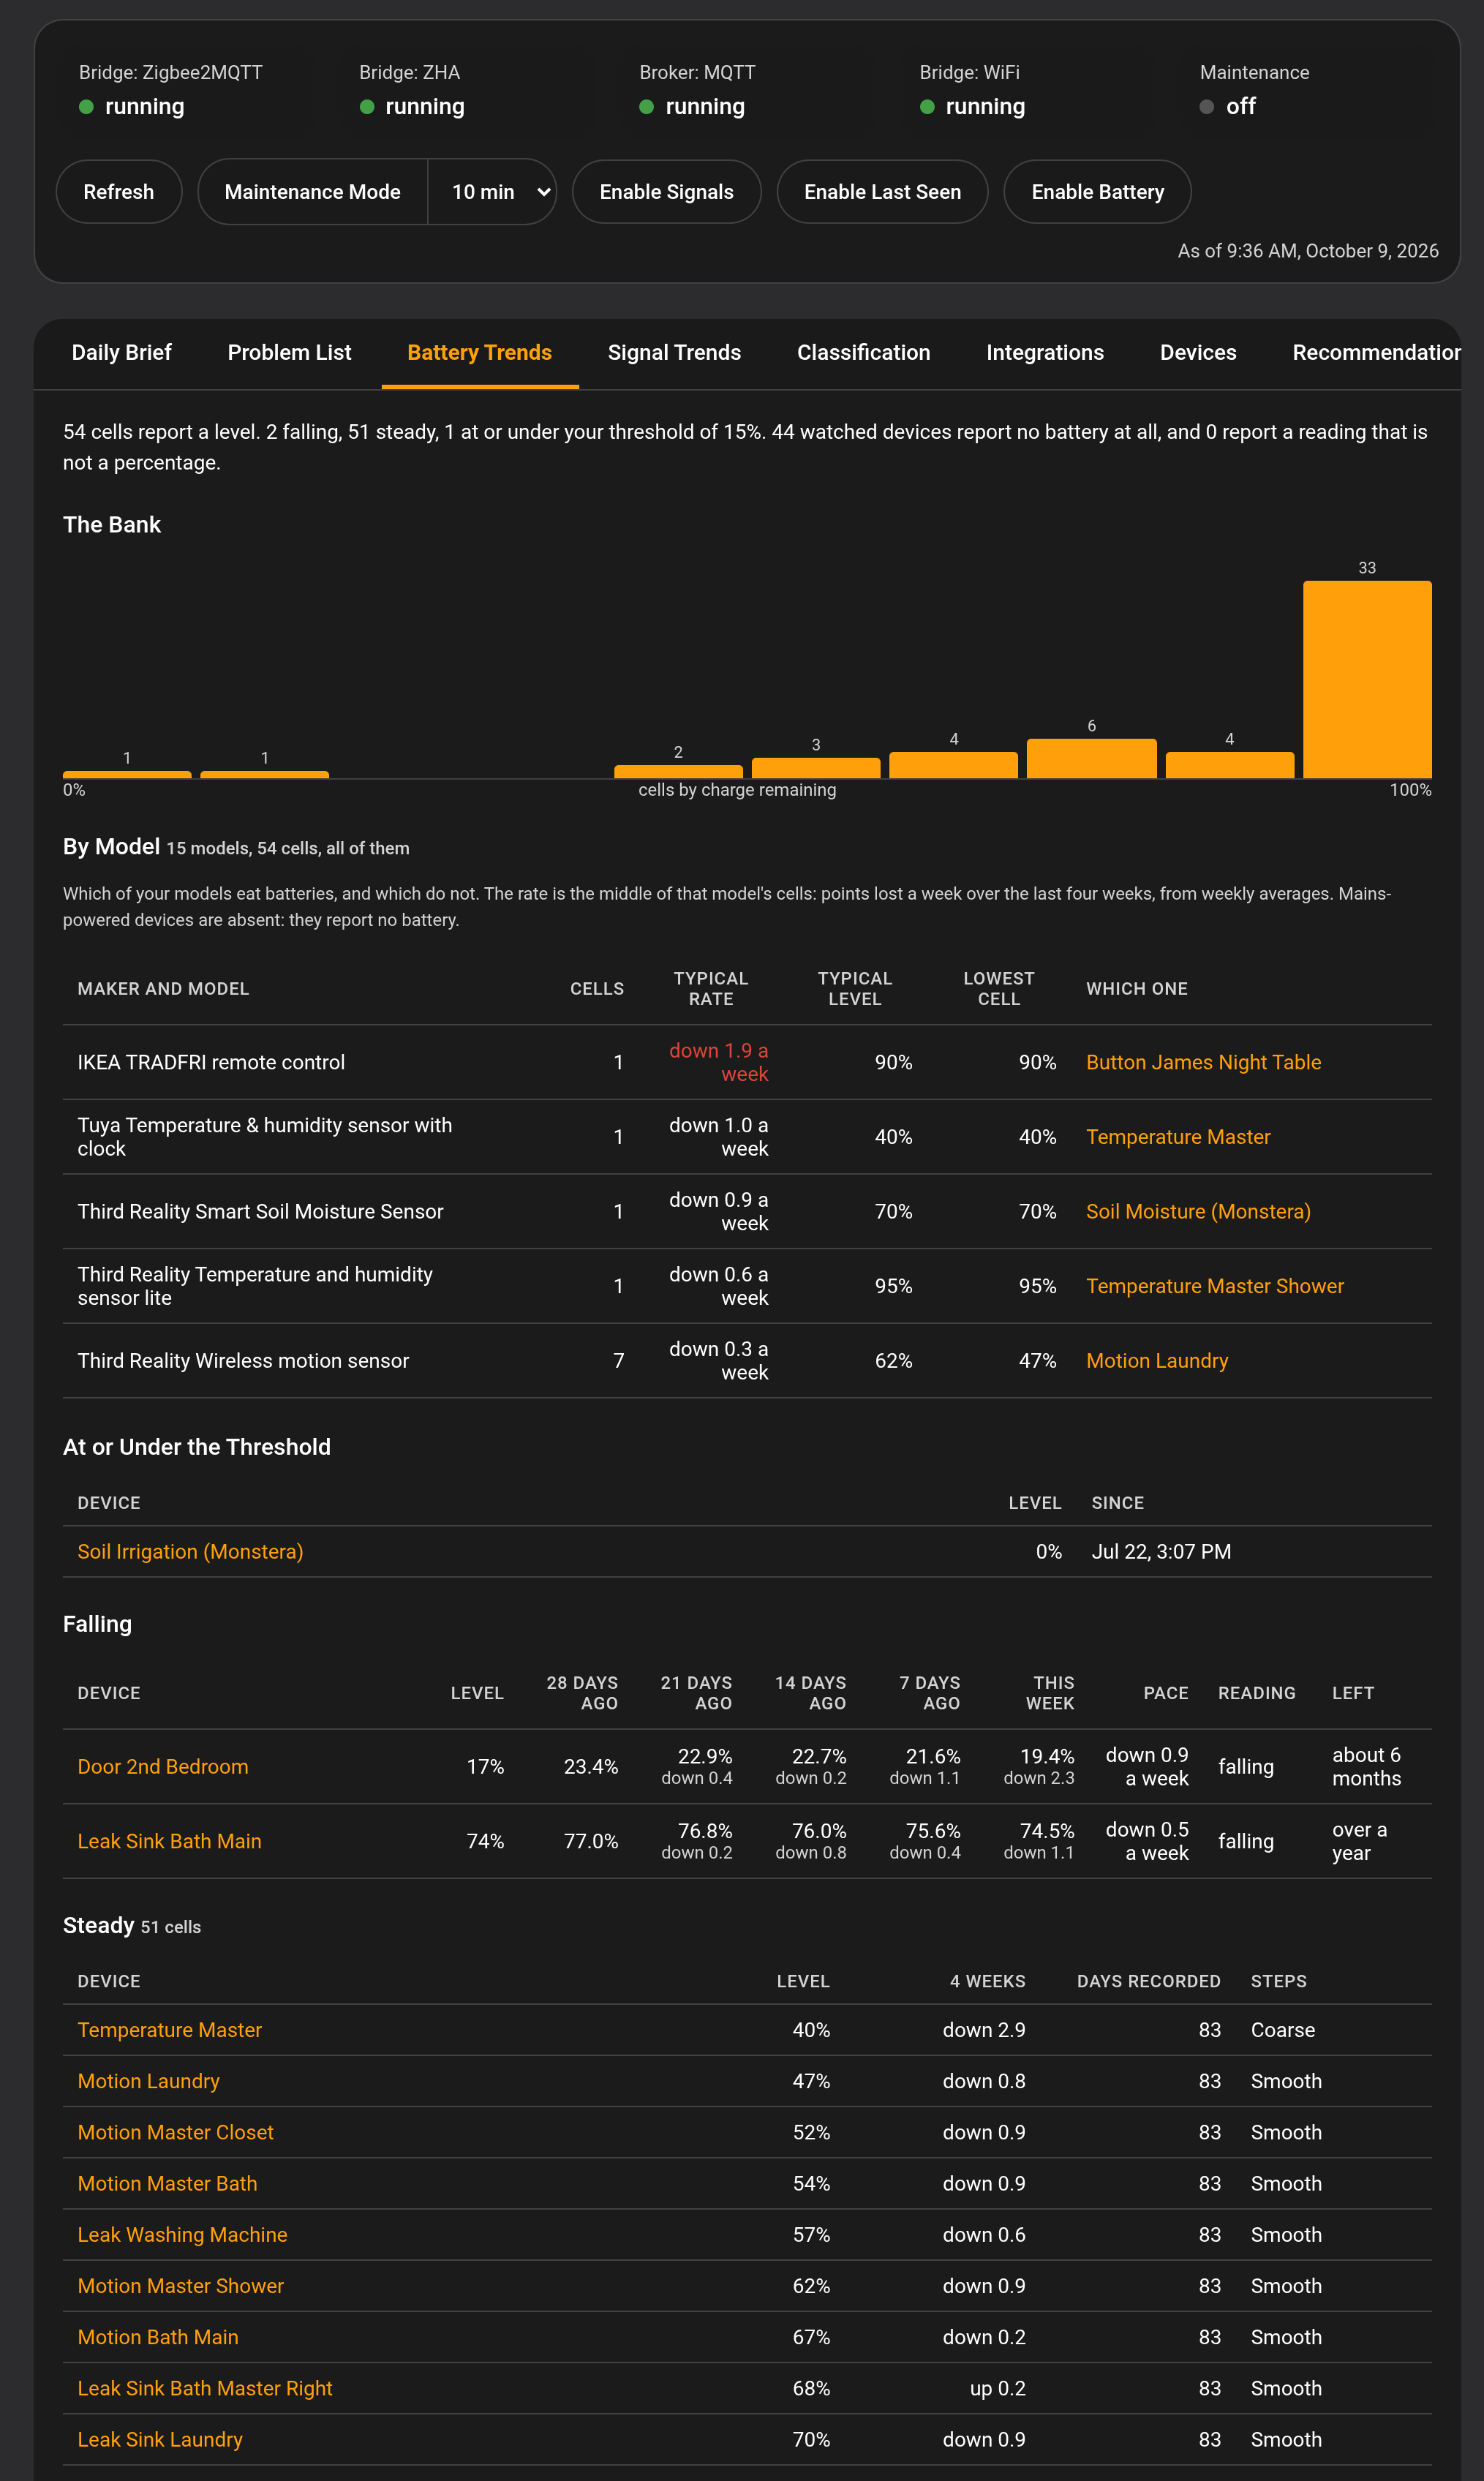
Battery Trends. All your batteries, grouped by maker and model: how many cells of each, how many points a week that model typically loses, and its weakest cell. Below that come the cells at or under your threshold; the falling cells, each with its last five weekly averages, whether it is falling or accelerating, and how long it has left; the steady ones, with how much each lost over four weeks; and any reading that isn't a percentage at all. A day Device Sentinel didn't hear a device is left out of its averages, not counted as a day with no change.
Every list sorts by any column, including type. Click a type in any row, or pick one from the list at the top, and the whole tab narrows to that type: the summary, the bank, the models and the lists. "Show all" brings everything back. By Model has a TYPE column; if a model's devices have different types, it lists each type with its count, such as "Motion Sensor 6, Presence Sensor 1".
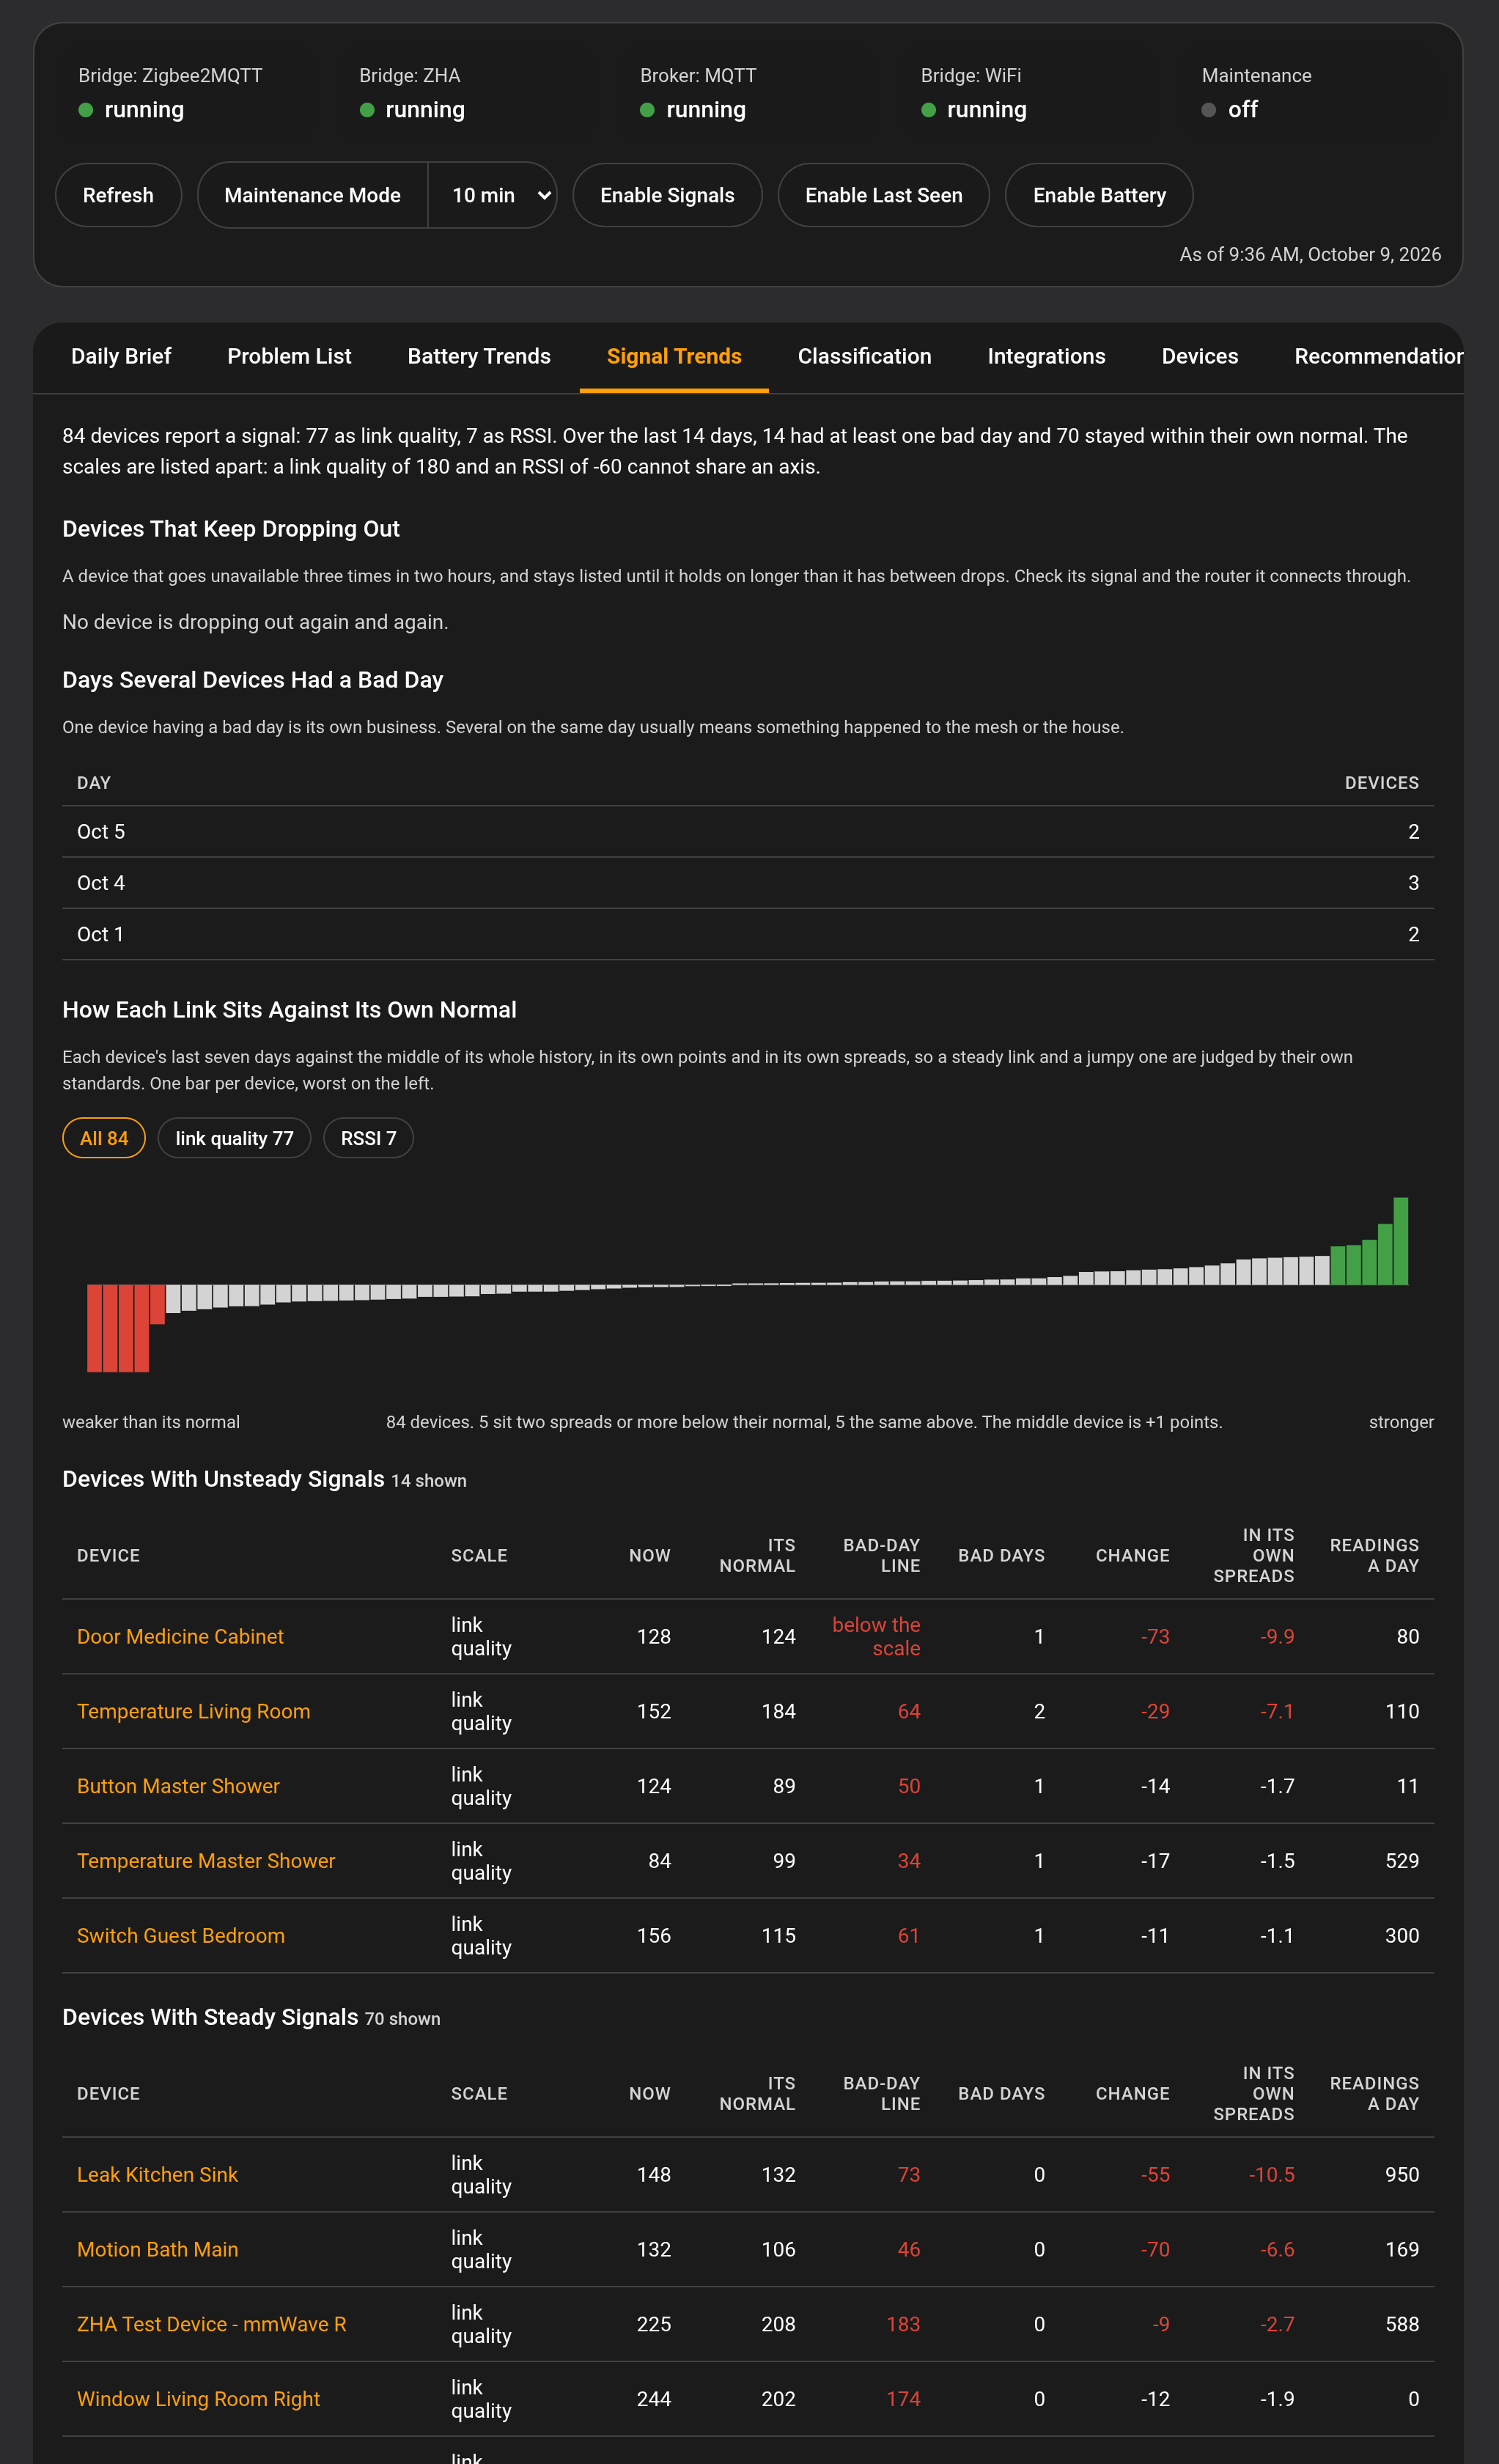
Signal Trends. How each radio link spent its last seven days against its own normal. Devices That Keep Dropping Out lists the ones going offline and back again and again, which usually means a weak route to them rather than a dying device. One bar per device, worst on the left, followed by the devices with unsteady signals, the devices with steady ones, and the days when several devices had a bad day together, which usually points at a coordinator or network event rather than one failing device. Link quality and RSSI are measured on different scales, so each list lets you pick one.
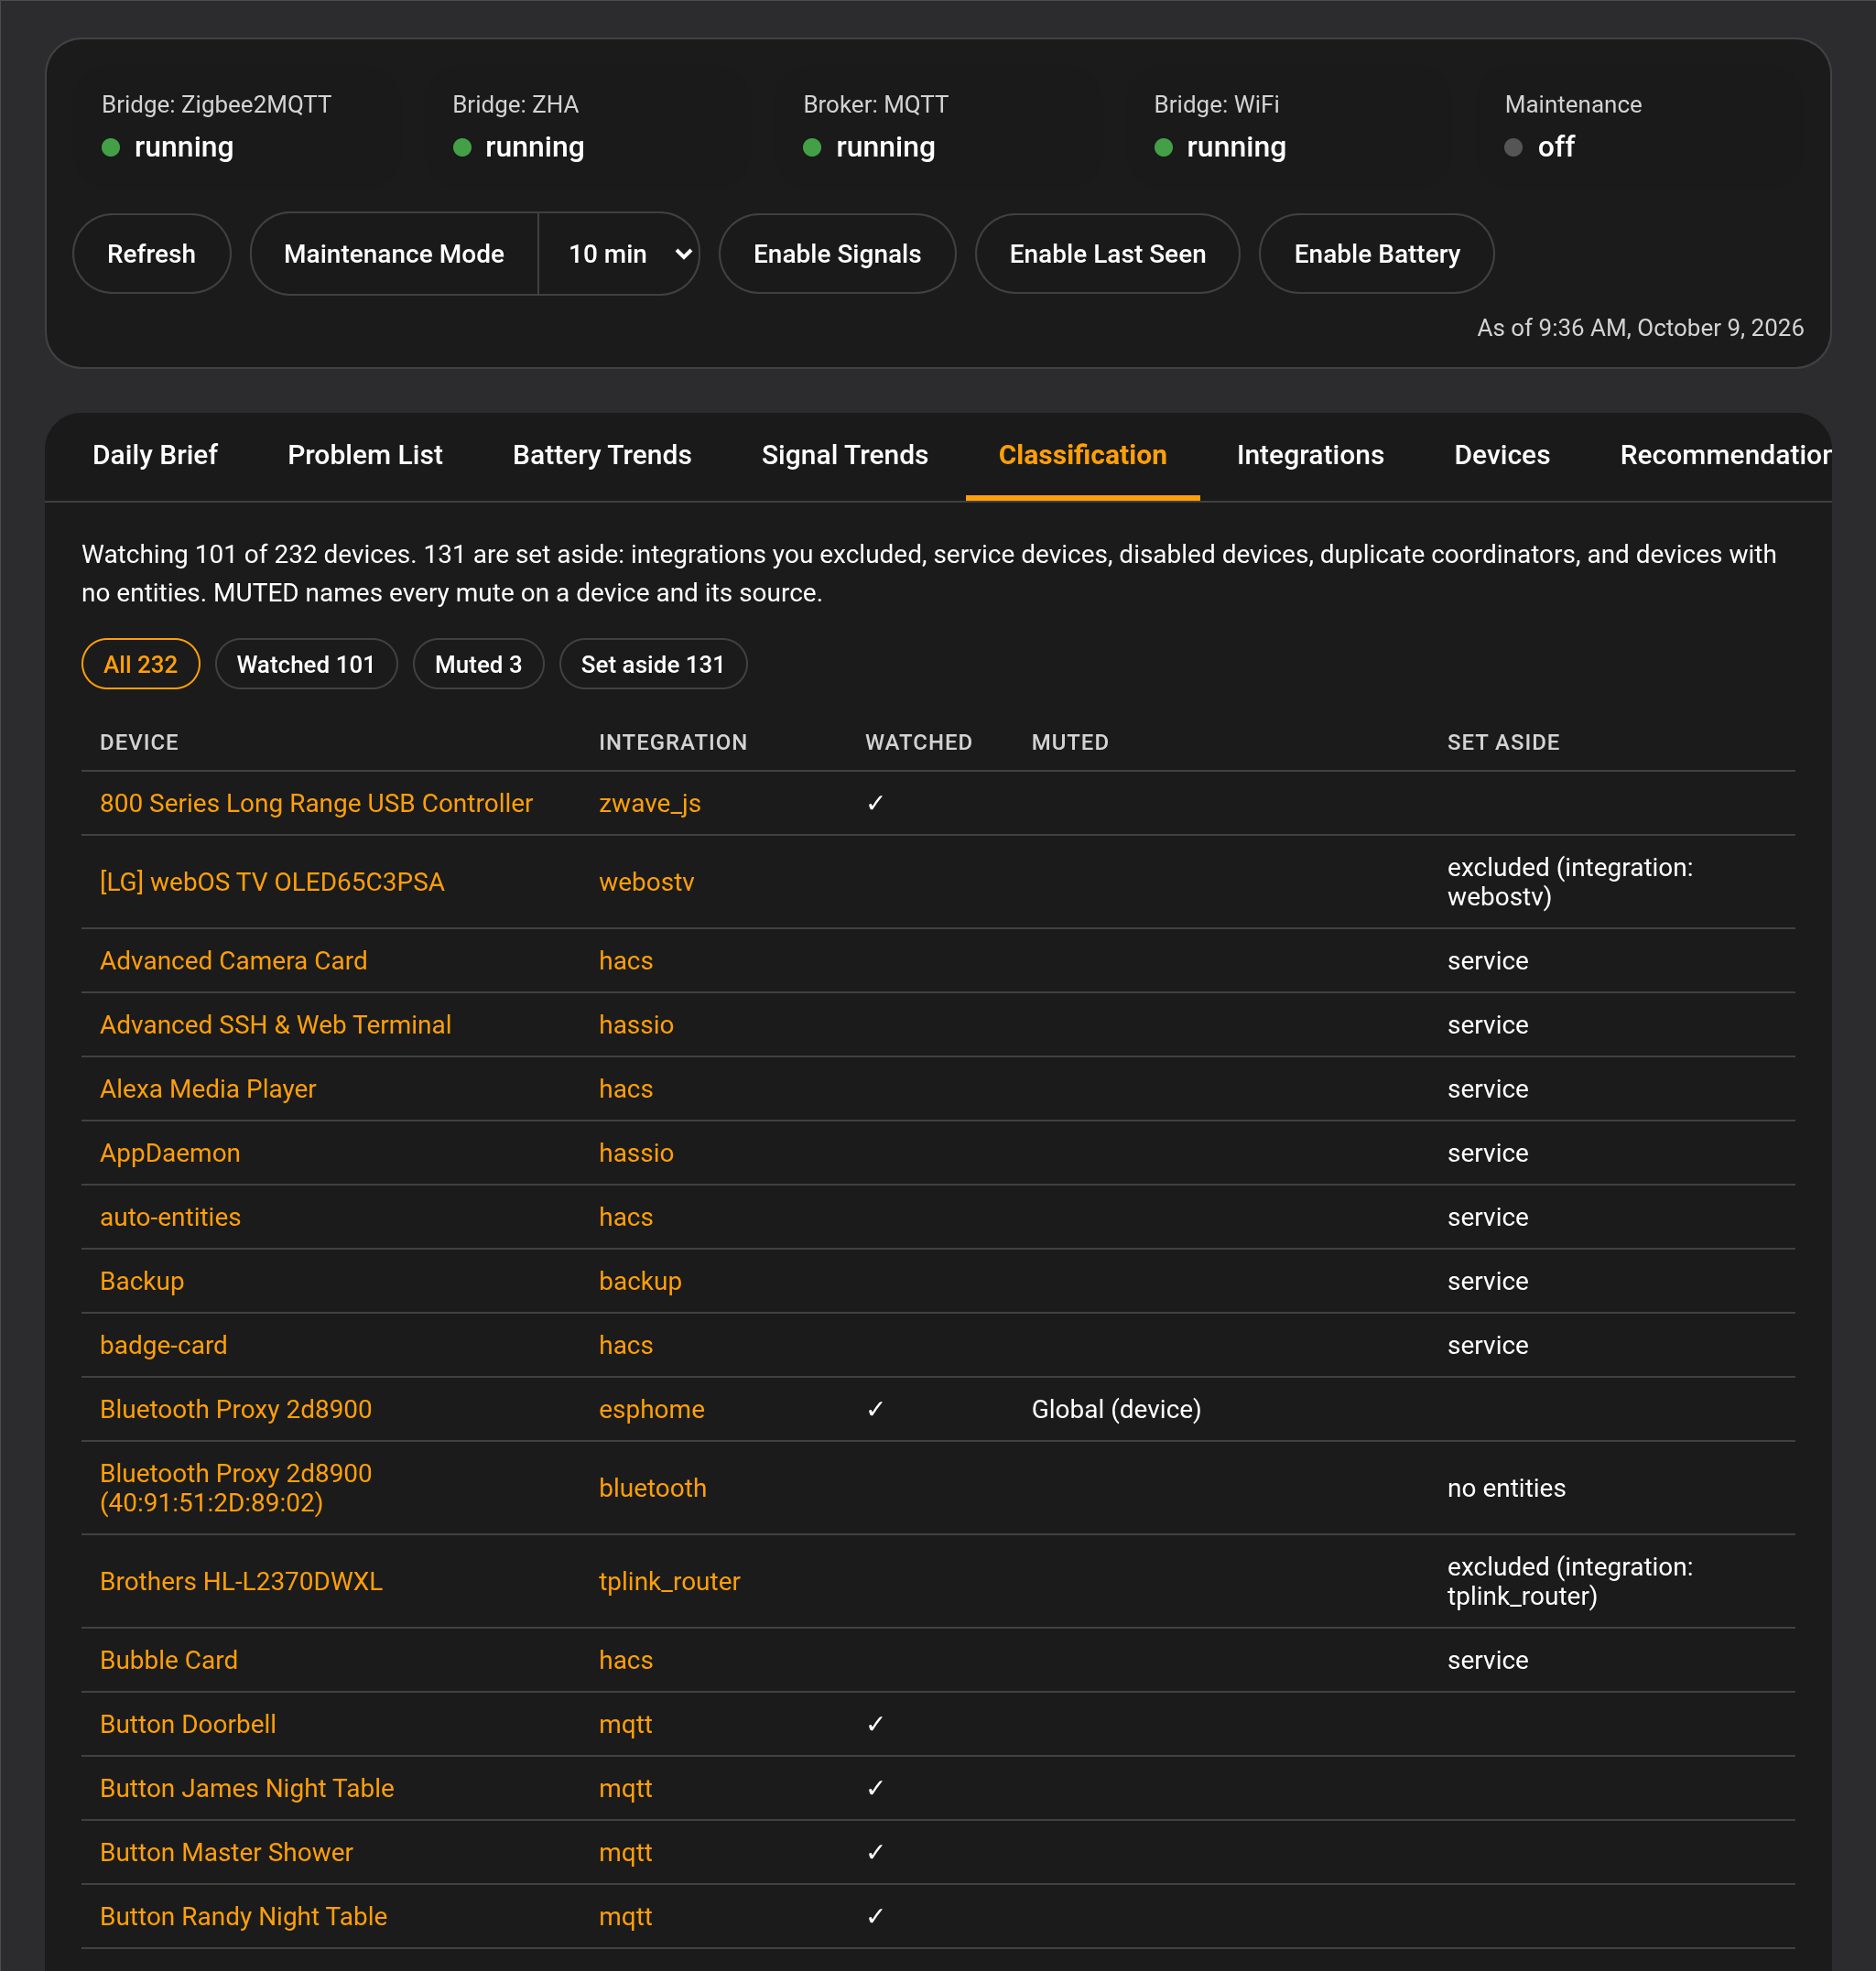
Classification. All the devices Device Sentinel found: whether it is watched, whether it is muted and by what, and if it was set aside, why. A device that another integration also lists reads "clone"; the one Device Sentinel watches is the one that reports. A TYPE column sits after INTEGRATION, every column sorts, and clicking a type narrows the table and the counts on the chips to that type.
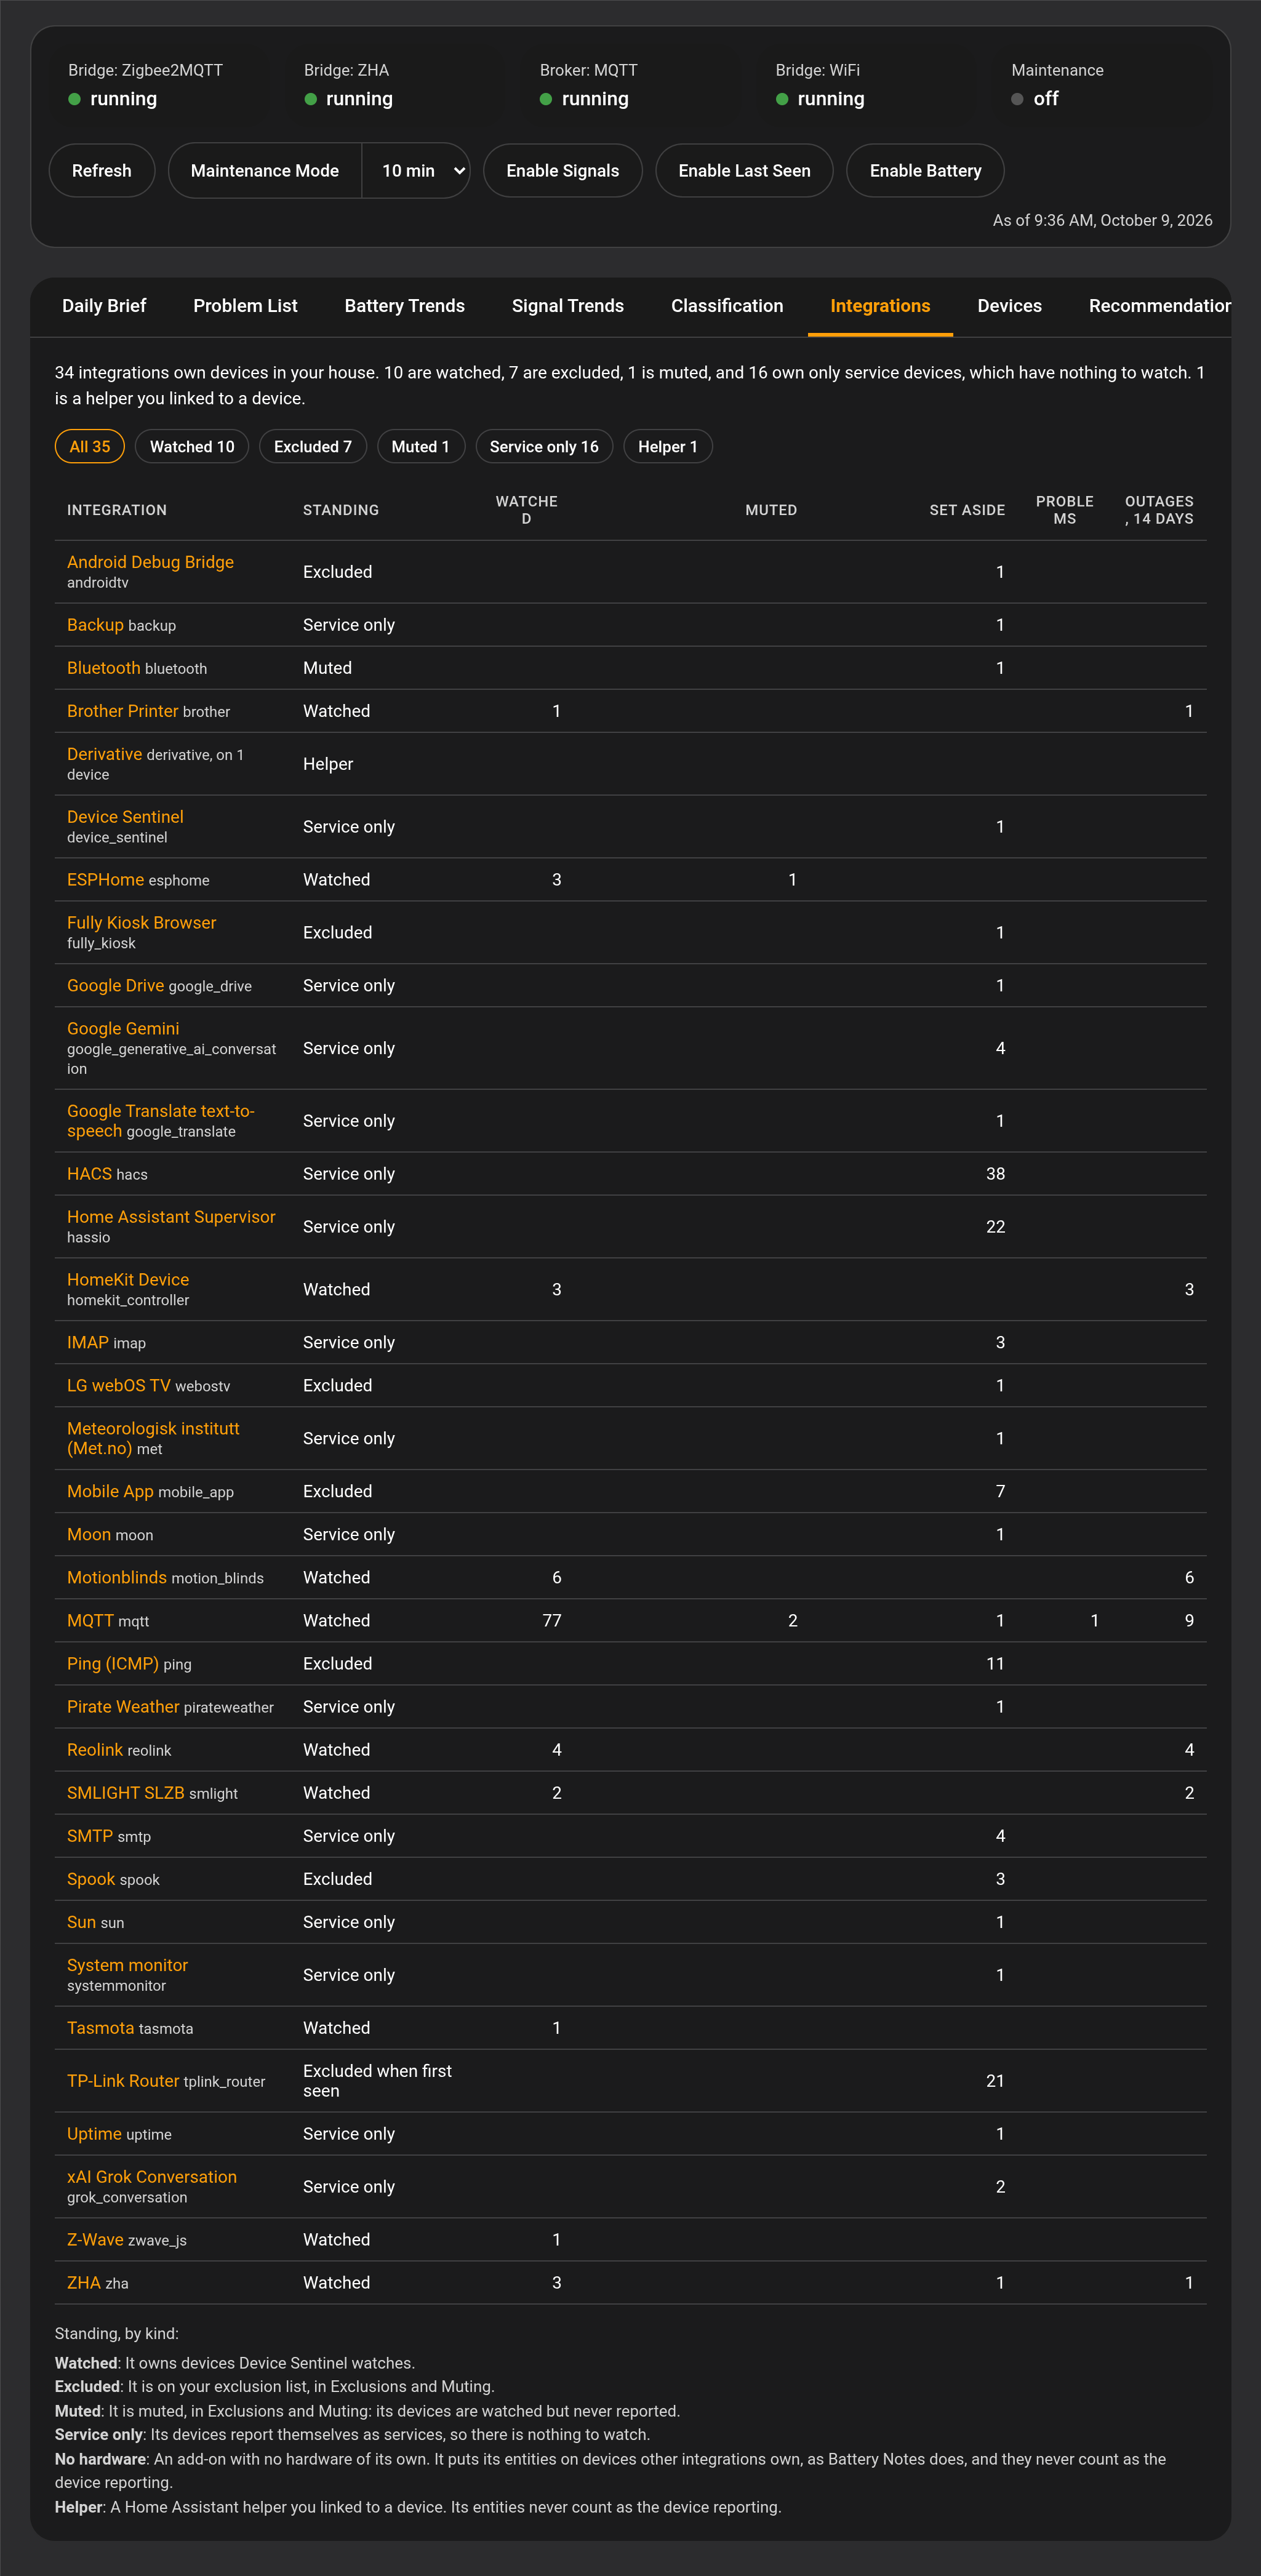
Integrations. One row per integration, with its standing and how many devices it has. Filter by standing: Watched, Excluded, Muted, Service only, No hardware or Helper. A key under the table says what each means.
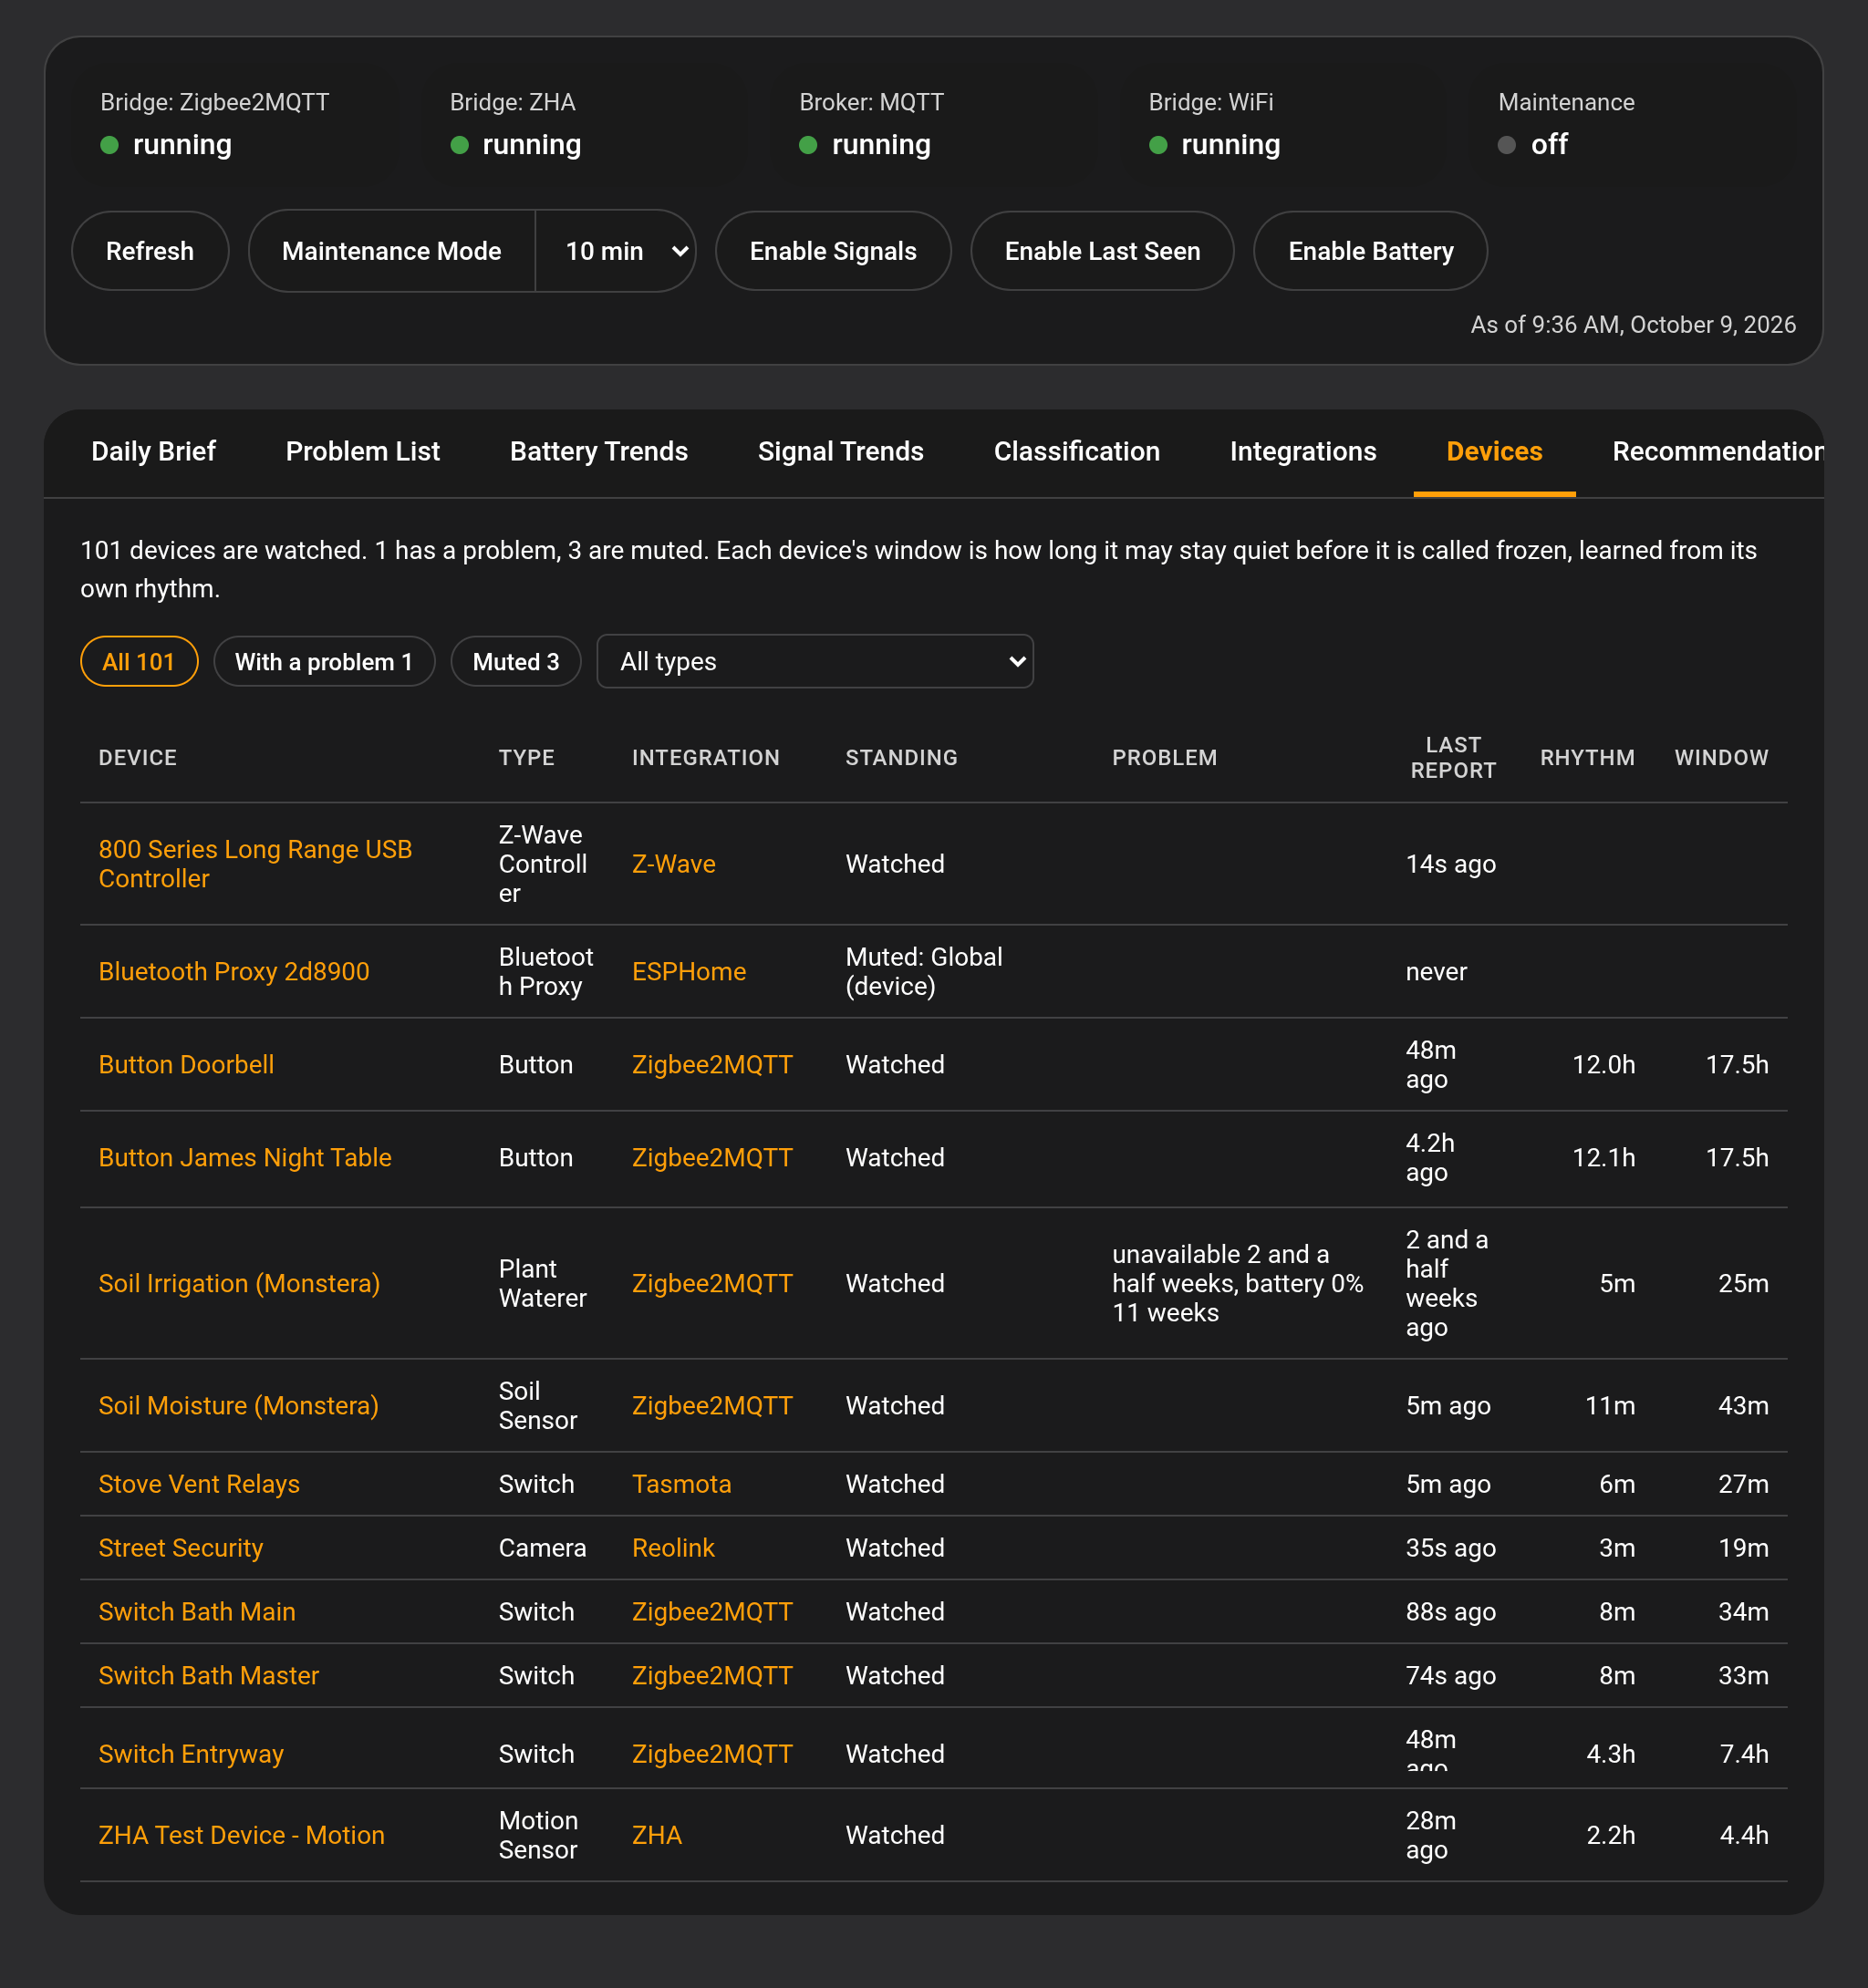
Devices. One row per watched device, with its type, its integration, its last report, its rhythm and its freeze window. The rhythm is the one from the freeze rule the device uses, so it matches the window beside it. Filter to the devices with a problem, or the muted ones, or click a type to see only that type. Each tab keeps its own choice of type.
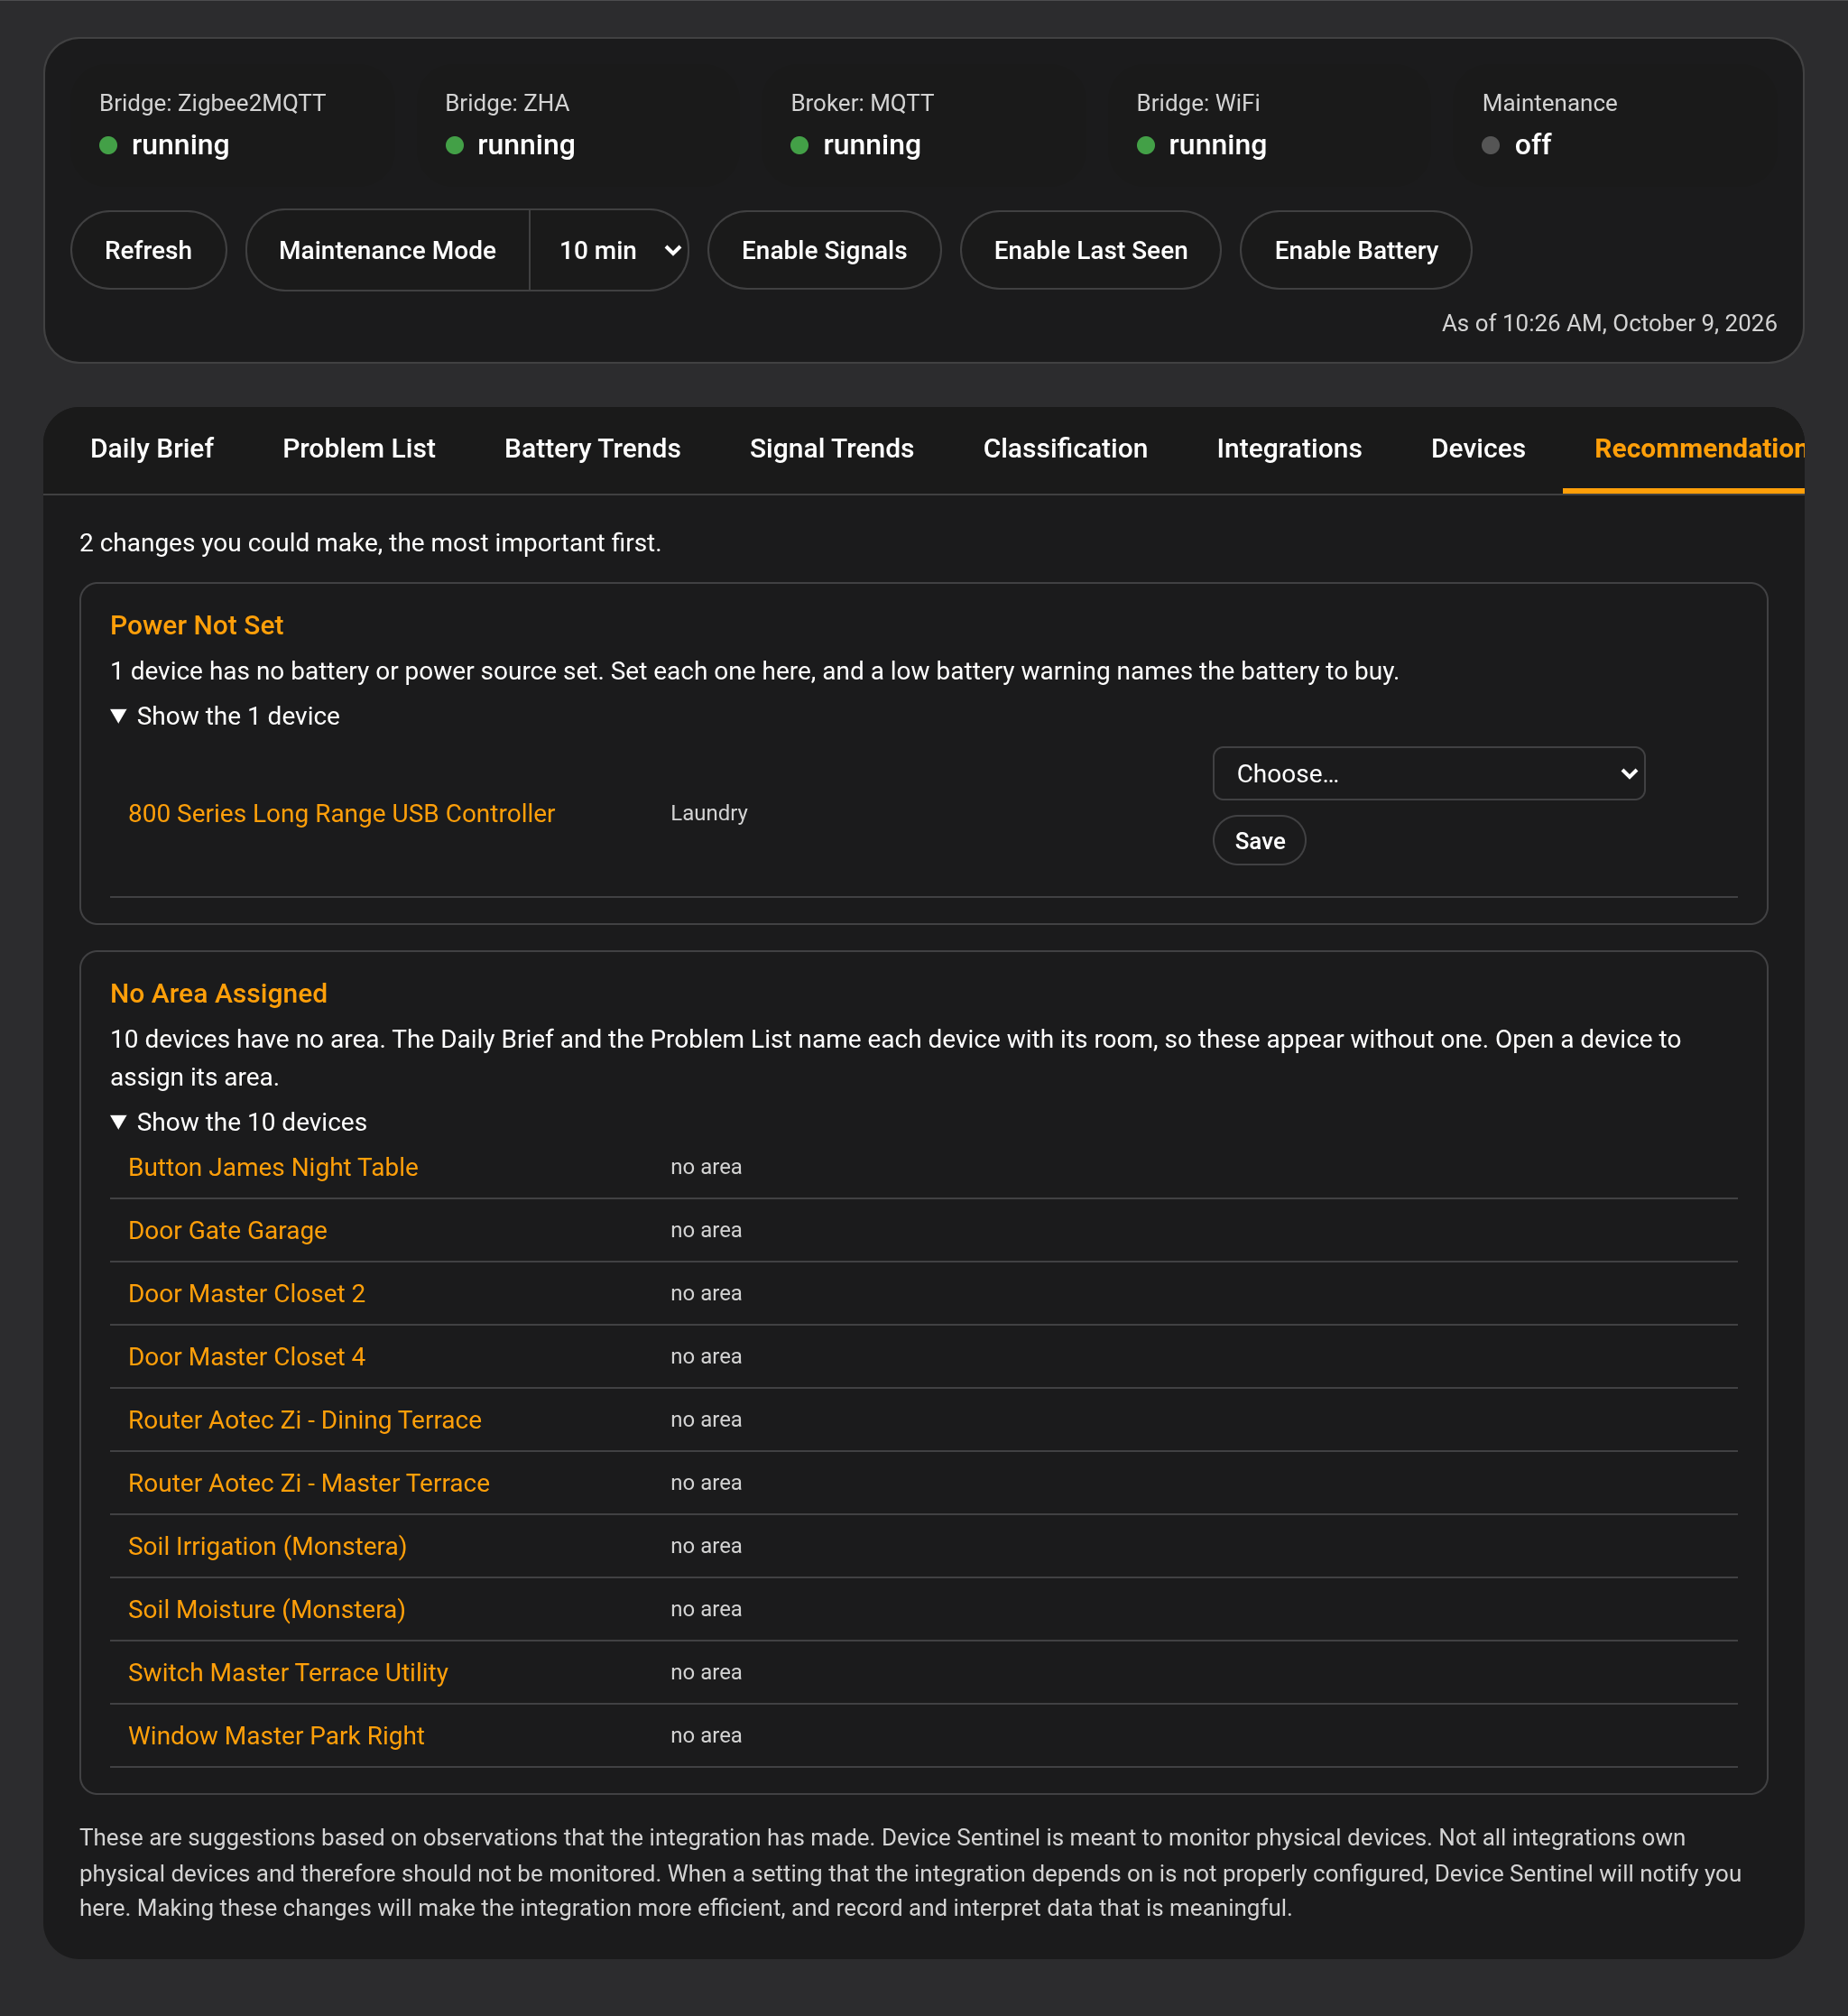
Recommendations. The suggestions about your setup that also appear in the daily brief, each with a link to Device Sentinel's settings. Four cards list devices you can fix right on the tab: Power Not Set (set each one's battery or power source, so a low battery warning names the battery to buy), Last Seen Sensor Switched Off (turn each one on, so Device Sentinel notices the device going quiet sooner), No Area Assigned and Devices Sharing A Name (open a device to assign its area or rename it). Two more cards are about types: Type Not Set lists the devices with no type, and you can pick one for each right in the list; Model With More Than One Type lists each model whose devices disagree about their type, so you can open the odd one out and set it to match.
Click any device name, on any tab, and you land on that device's page. Click any integration name and you land on the integration's page. A battery that needs changing on Battery Trends is one click from everything known about the device it sits in.
Each of these pages has a back link at the top naming the exact tab or page you came from, and it survives a reload.
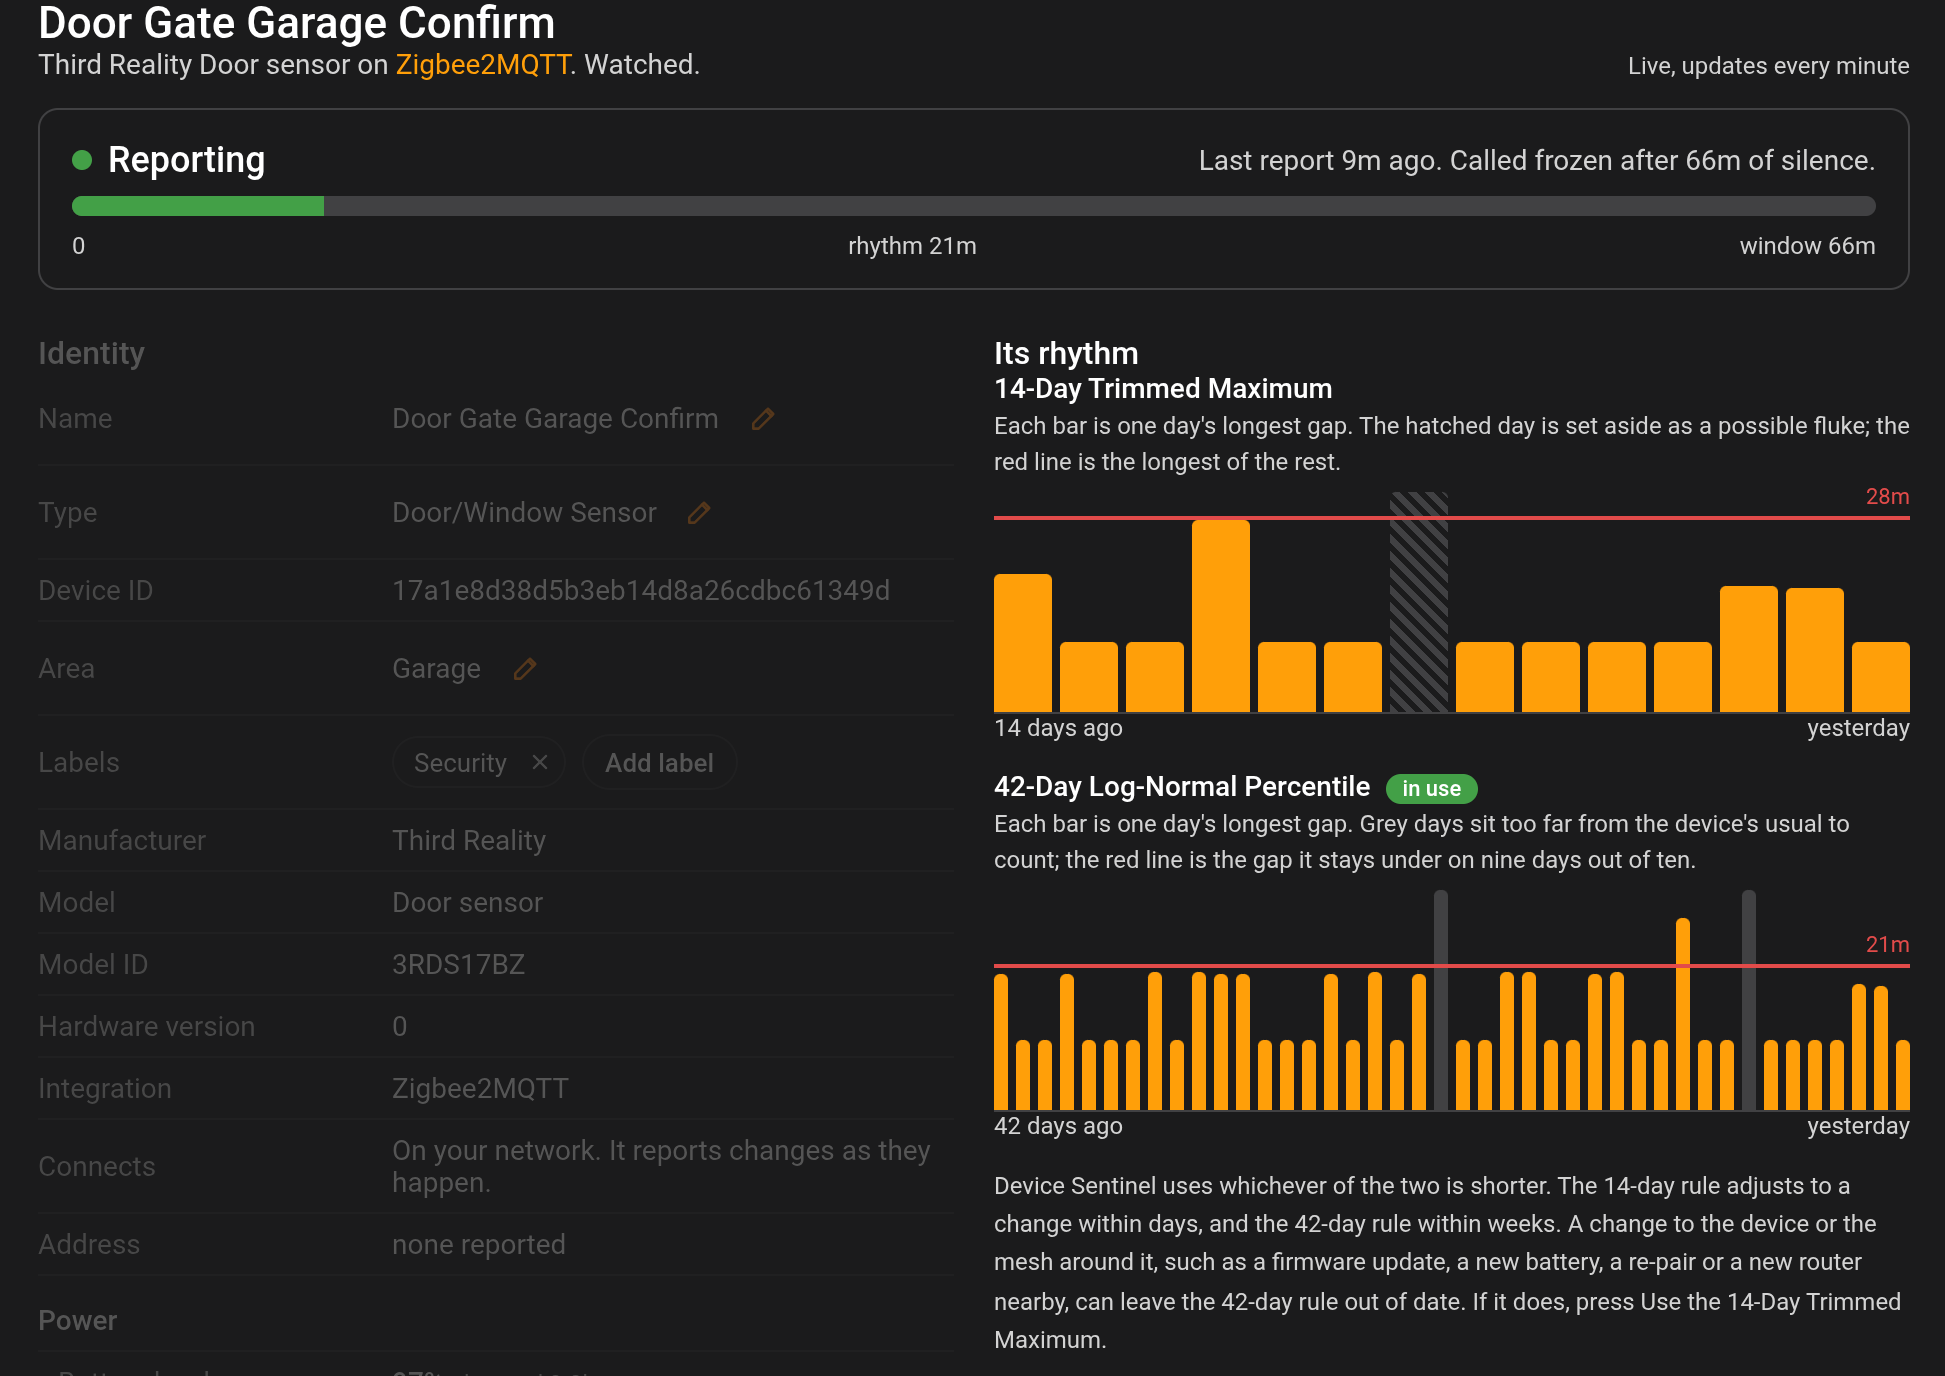
Everything Device Sentinel knows about one device, and the one view on the dashboard that stays live: its status and silences refresh each minute while the page is open, and its battery, signal and last-seen readings redraw the moment the entity changes. Previous and Next at the top step through the list you opened it from, such as the Devices tab, the Problem List or a recommendation card, and Open in Home Assistant opens Home Assistant's own page for the device.
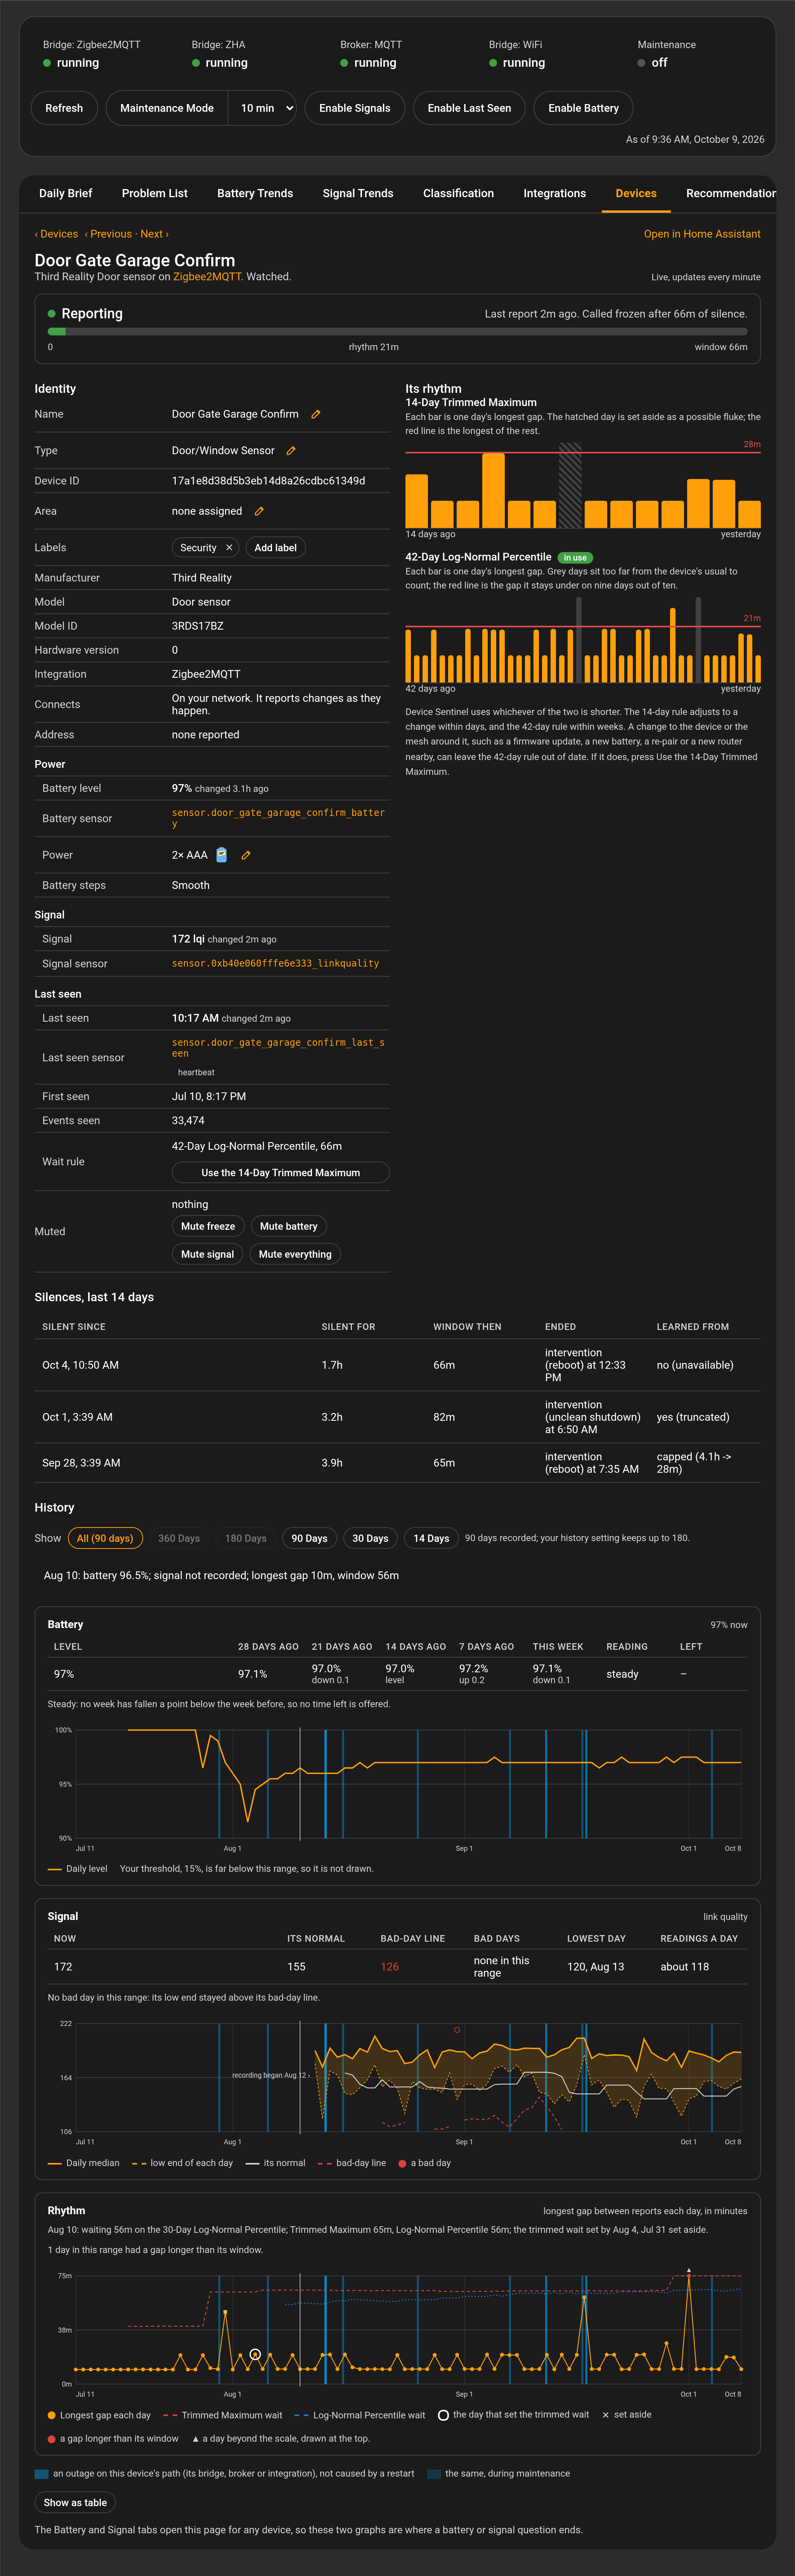
- Status. Reporting, Frozen, Unavailable, Flapping, Unknown, Never reported or Set aside. A muted device still shows its true status, in grey, so "Frozen, muted" means the device is down and nobody asked to hear about it.
-
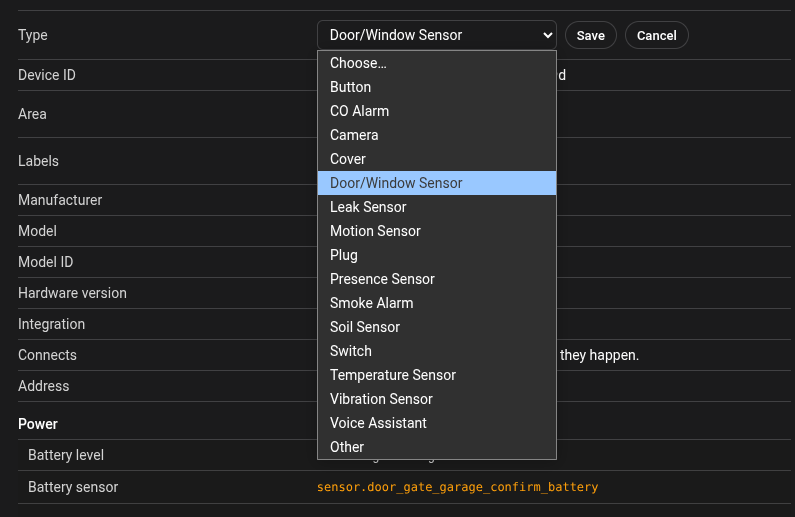
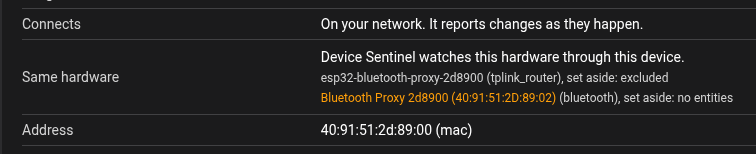
Identity. Name, type, device ID, area, labels, maker, model, model ID and hardware version, integration, how it connects (on your network or through the maker's cloud, and whether it reports changes as they happen or is checked at set times), and its address. If another integration also lists the same hardware, a Same hardware row names each copy, its integration, and why it isn't watched. The type comes from the device's own entities or from a known model, and the pencil beside it lets you choose another; your answer covers every device of that model. Then three groups, each value with when it last changed and each sensor a link that opens it in Home Assistant:
- Power: battery level, battery sensor, power and battery steps.
- Signal: signal and signal sensor.
- Last seen: last seen, the Last Seen sensor, when it was first seen, how many events it has sent, and its wait rule. If the device has no Last Seen sensor Device Sentinel can read, Last seen shows when Device Sentinel last heard it.
- Power. The battery the device takes, such as "2× CR2032", from the Battery Notes device library that comes with Device Sentinel, whether or not you run Battery Notes. Press the pencil to set it yourself: a common battery and how many, Mains Powered, USB Powered, USB Direct to Server (a stick or dongle plugged into the Home Assistant machine), PoE Powered, or your own words. What you set covers all devices of the same model. An icon beside the answer says where it came from, the Battery Notes library or you. After you save a battery the library doesn't know, Send to Battery Notes opens Battery Notes' New Device form, filled in, so the library's author can review it and add it for everyone.
- Changes from the page. Rename the device, change its area, add or remove labels, switch on its Last Seen sensor, and mute it for freeze, battery, signal or everything. Each change writes to Home Assistant and shows in the daily brief on the device's own line. Nothing asks you to confirm a change you can undo; Mute everything asks once. If Home Assistant refuses a change, its reason shows under the row. A name another device already uses is held until you choose Change name or Save anyway. A label or an area that doesn't exist yet can be made from the picker. The other tabs pick up a change made here without pressing Refresh.
- Muted. Each mute on the device and where it comes from. A mute set by a label or an integration shows lit and can't be lifted here; the line under it says where in Device Sentinel's settings to change it.
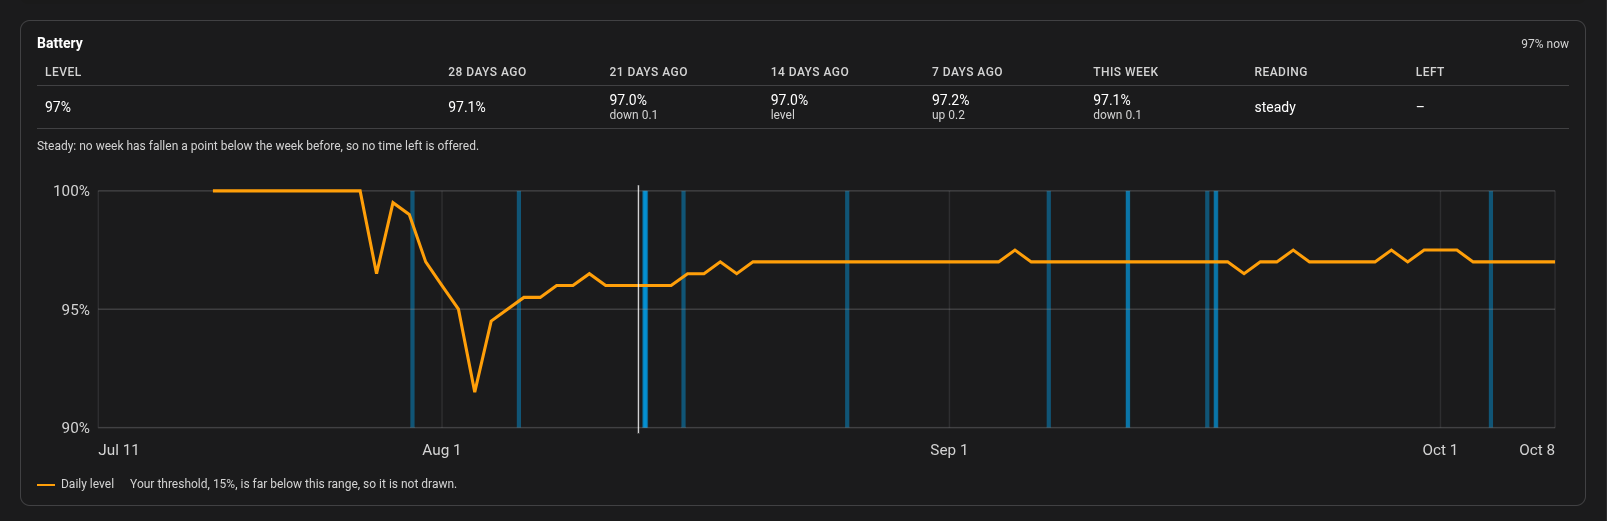
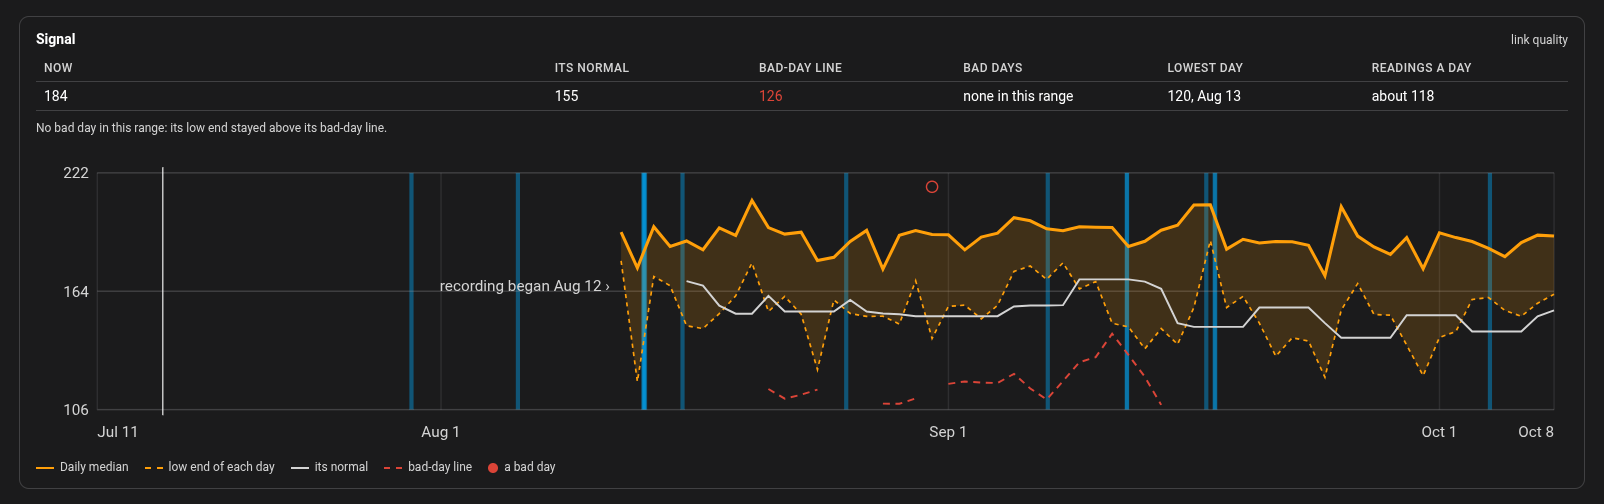
- Graphs. Battery, signal and rhythm, stacked on one date axis: All, 360, 180, 90, 30 or 14 days. The rhythm graph shows each day's longest gap against the window it had that day, with a red dot where a gap ran past it, and both freeze rules' waits as dashed lines. Outages on the device's own path are shaded behind all three, and a line breaks on a day Device Sentinel didn't hear the device. Point at a day to read it, or choose Show as table to read the range day by day.
- Its rhythm. The two freeze rules side by side, the Trimmed Maximum and the Log-Normal Percentile, each titled with the number of days it read and showing the days it set aside and its result as a red line. The one in use is tagged. Device Sentinel uses whichever is shorter. A change to the device or the mesh around it, such as a firmware update, a new battery, a re-pair or a new router nearby, can leave the 42-day rule out of date; if it does, press Use the 14-Day Trimmed Maximum. Freeze Detection explains both rules.
- Battery. The level for each of the last five weeks and how much each week lost, whether the battery is steady, falling or accelerating, how long it has left, and one sentence saying what that means. At 30 and 14 days the graph adds the weekly averages in orange and, for a falling battery, a line showing its pace, with the day it started falling faster marked.
- Silences. The last fourteen days of them, including the ones set aside and the reason.
Its devices, the ones with problems first. Its outages over the last fourteen days, each paired with its return. Its bursts of updates over the last seven days, and any recommendation that names it.
The dashboard reads the integration's own data directly. It never waits on a report file being written, and the tabs never disagree with the problem list, because they read the same record.
The daily brief is also written as a file, for email and printing, and a few other files are kept for sharing with someone helping you. The Diagnostic Reports covers the ones kept for troubleshooting.