


Companion to nplusone.
One finds the query you run too many times. This one finds the query with no index.
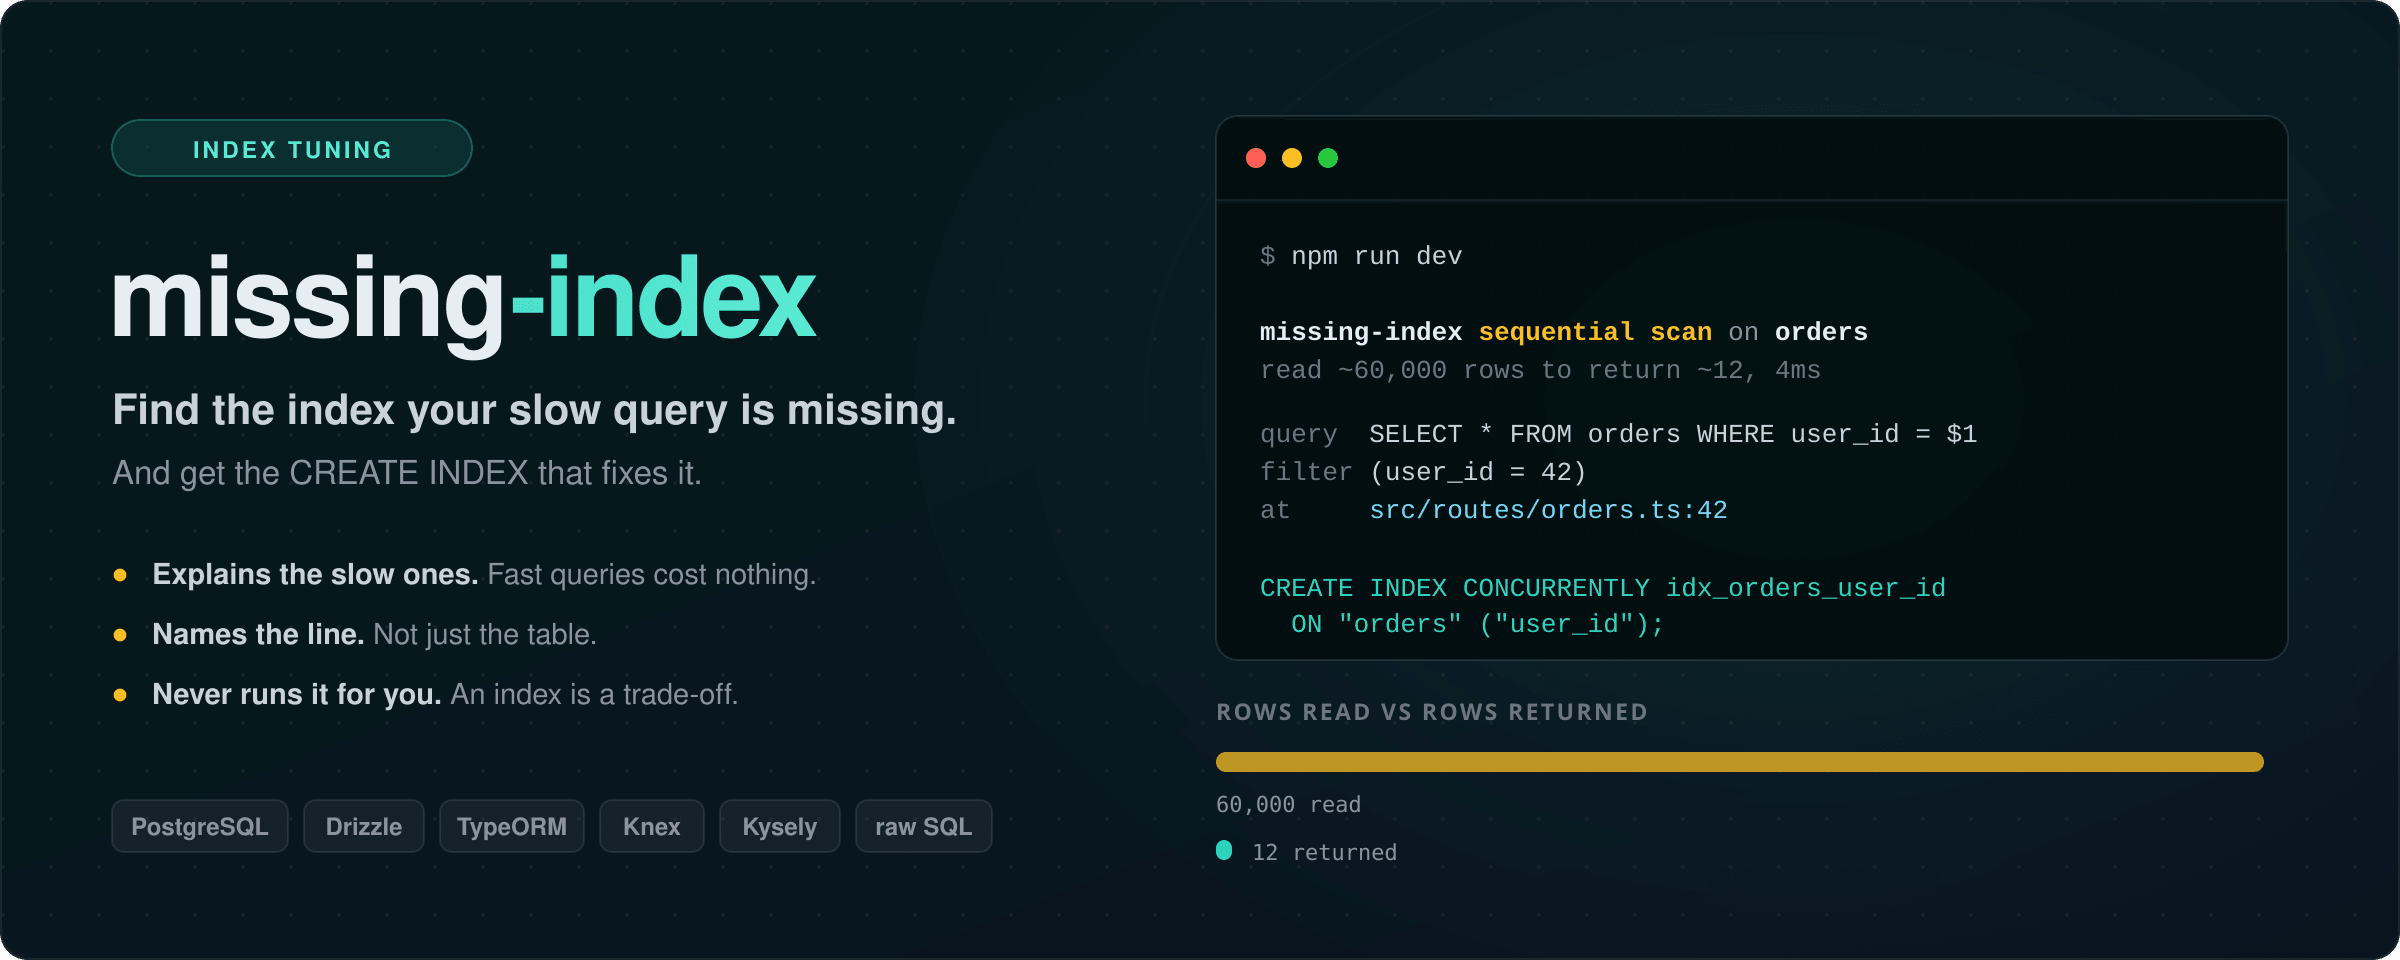
missing-index sequential scan on orders — read ~60,000 rows to return ~12, 4ms
  query  SELECT * FROM orders WHERE user_id = $1
  filter (user_id = 42)
  at     src/routes/orders.ts:42:14

  CREATE INDEX CONCURRENTLY idx_orders_user_id ON "orders" ("user_id");
That is real output, not a mockup — 60,000 rows read to return 12.
npm install --save-dev missing-indexTested on Node 18, 20, 22 and 24.
The package is ESM. import works on every version above; require() works
from Node 20.19 onwards, which is where Node backported requiring an ES module.
On Node 18 — end-of-life since April 2025 — use import.
import pg from "pg";
import { configure } from "missing-index";
import { instrumentPg } from "missing-index/pg";

configure({ thresholdMs: 50 });
instrumentPg(pg);
That is the whole setup. Run your app, use it normally, and anything worth indexing prints itself.
Because it hooks the driver, everything on top of pg is covered without its own adapter: Drizzle, Knex, TypeORM, Sequelize, Kysely, raw SQL.
When a query takes longer than thresholdMs, the library runs EXPLAIN on it and looks for one specific thing: a sequential scan carrying a filter. That means PostgreSQL read the whole table and threw most of it away.
It then asks the planner how big that table really is, and only speaks up when the scan was expensive.
Three decisions are worth knowing about, because they are what keeps it usable:
It measures the table, not the result. A node's Plan Rows is how many rows survive the filter — reading 60,000 rows to return 12 shows up as "12". Judging by that number would discard exactly the queries worth reporting, so the size comes from pg_class.reltuples instead, which is the planner's own estimate and costs one indexed lookup.
ANALYZE is off. With it, PostgreSQL executes the statement to measure it — which for an UPDATE means running it twice. The estimated plan is enough to see a sequential scan, and it cannot corrupt anything. Only SELECTs are explained at all, and a SELECT hiding a write in a CTE is skipped.
Equality columns come before the range column. WHERE status = $1 AND created_at > $2 suggests (status, created_at), never the reverse — a range column placed first makes the rest of a composite index unusable for the equality lookup. That is the most common mistake in a hand-written composite index.
configure({
  thresholdMs: 50,              // only explain queries slower than this
  minRows: 1000,                // ignore tables smaller than this
  ignoreTables: [/^audit_/],    // never suggest indexes for these
  ignore: [/pg_catalog/],       // never explain queries matching these
  captureStack: true,           // attribute each finding to a line of code
  onFinding: (f) => metrics.increment("missing_index", { table: f.suggestion.table }),
  reporter: (f) => logger.warn(f),
  enabled: process.env.NODE_ENV !== "production",   // the default
});
Each suggestion is printed once per process, so a query in a loop does not repeat the same CREATE INDEX fifty times.
Explaining a query costs one extra round trip, which is why thresholdMs exists — fast queries are never explained, whatever their plan looks like. The detector is disabled when NODE_ENV === "production" unless you turn it on deliberately.
EXPLAIN runs on the same connection as the original query, so it sees the same search_path, temporary tables and transaction state. A different connection would explain a different query.
Worth knowing before filing an issue:
- PostgreSQL only right now. MySQL's
EXPLAINhas a different shape; an adapter is welcome. - It suggests, it does not decide. An index costs write throughput and disk. On a write-heavy table the suggestion may be the wrong trade — the tool has no way to know that, and says so by printing SQL rather than running it.
- The suggestion is never run for you, on purpose. It comes with
CONCURRENTLYso it is safe on a live table; a plainCREATE INDEXlocks writes for its whole duration. - Partial and expression indexes are out of scope. A filter like
WHERE lower(email) = $1needsON (lower(email)), and the suggestion will name the column rather than the expression. - Tables never
ANALYZEd have no statistics, so nothing is reported for them.
npm test                    # unit tests, no database needed
MISSING_INDEX_PG=1 npm test # plus integration against a real PostgreSQL
The integration tests need a throwaway server:
docker run -d --name mi-pg --tmpfs /var/lib/postgresql/data:rw,size=512m \
  -e POSTGRES_PASSWORD=test -e POSTGRES_DB=testdb \
-e PGDATA=/var/lib/postgresql/data/pg -p 55440:5432 postgres:16-alpineMIT