




- We use
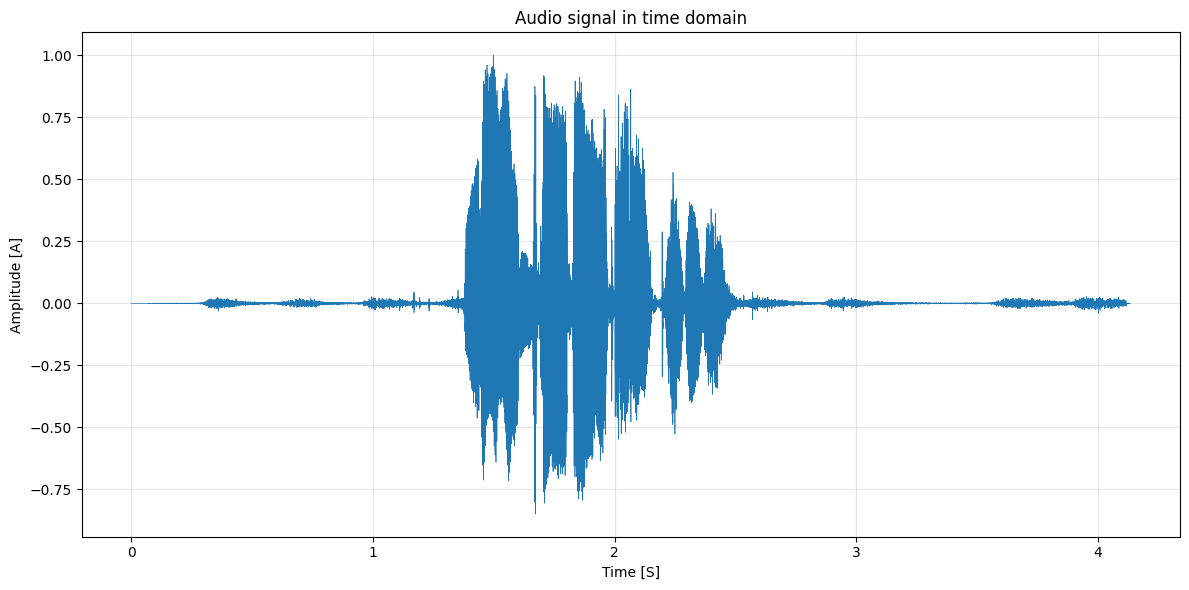
librosato load and process audio files. - The sample is a 4-second audio clip sampled at 22050 Hz.
- Time-domain waveform plot:
mmmm.mov
-
VAD detects segments with human speech.
-
Steps:
- Normalize signal amplitude to [-1, 1]
- Apply a threshold to filter speech vs noise
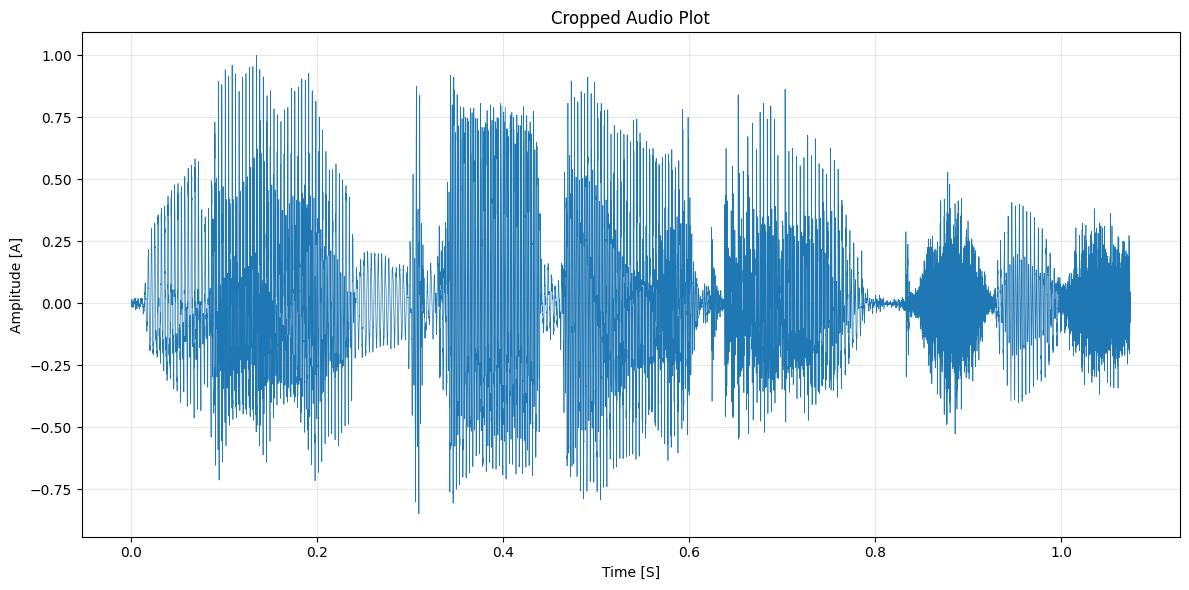
- Clip the audio to keep only speech segments
VAD Output Plot:
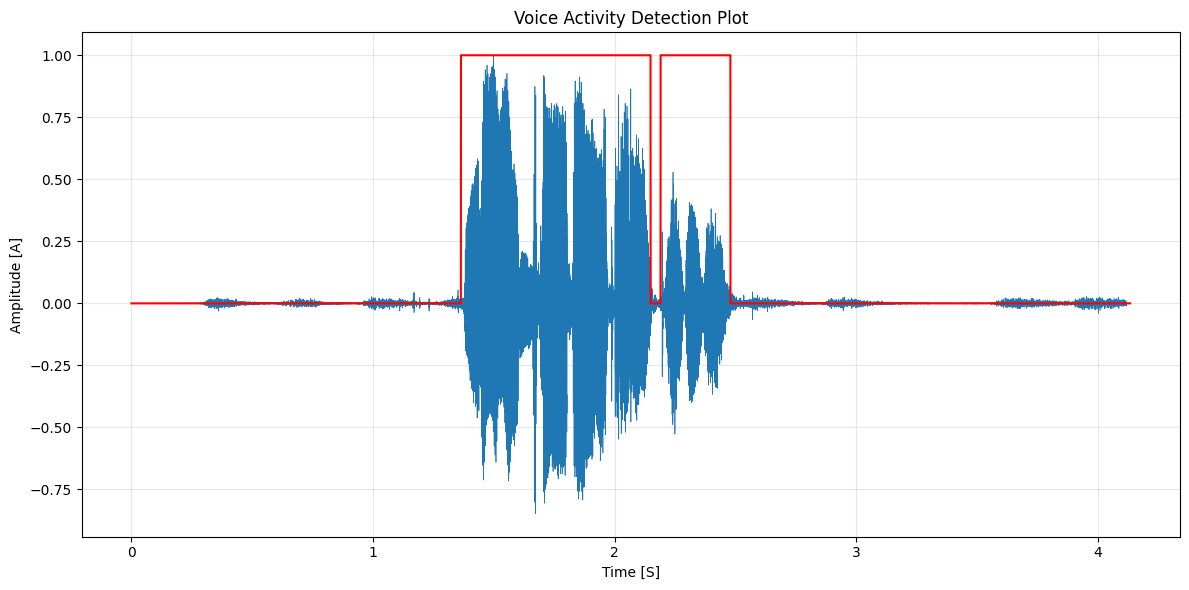
- Red: VAD mask
- Blue: Original signal
- Selected range: Retained for clipping
Cropped Signal Plot:
2.vad_croped.mov
-
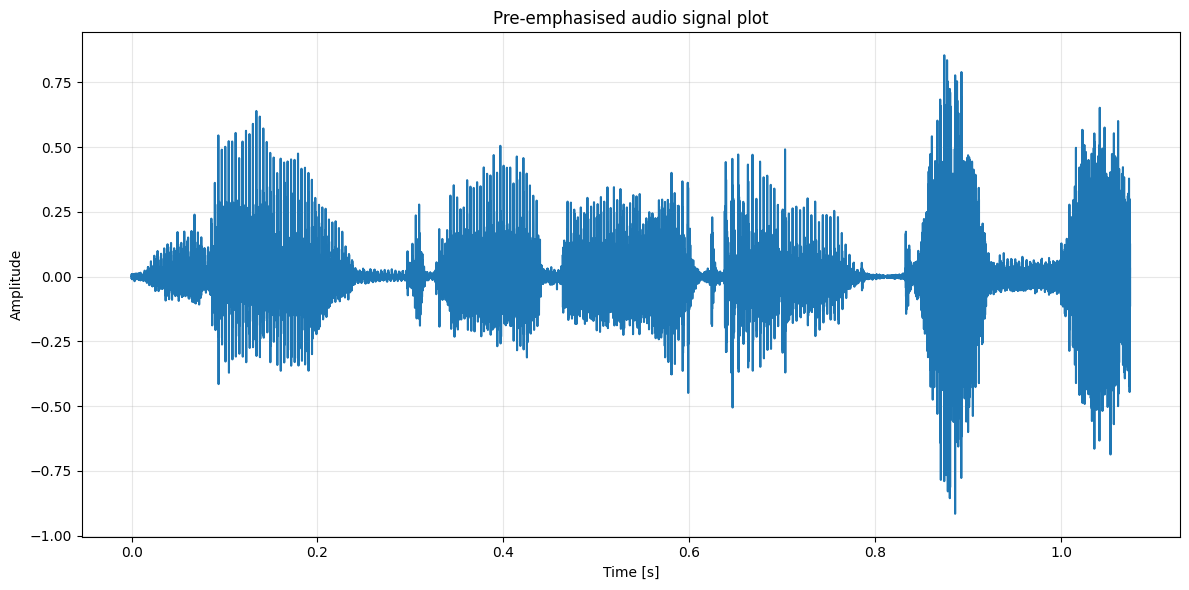
Enhances high frequencies before analysis.
-
Helps:
- Balance spectrum
- Avoid numerical issues in FFT
- Improve SNR
Filter Equation:
Plot after Pre-emphasis:
3.preempha.mov
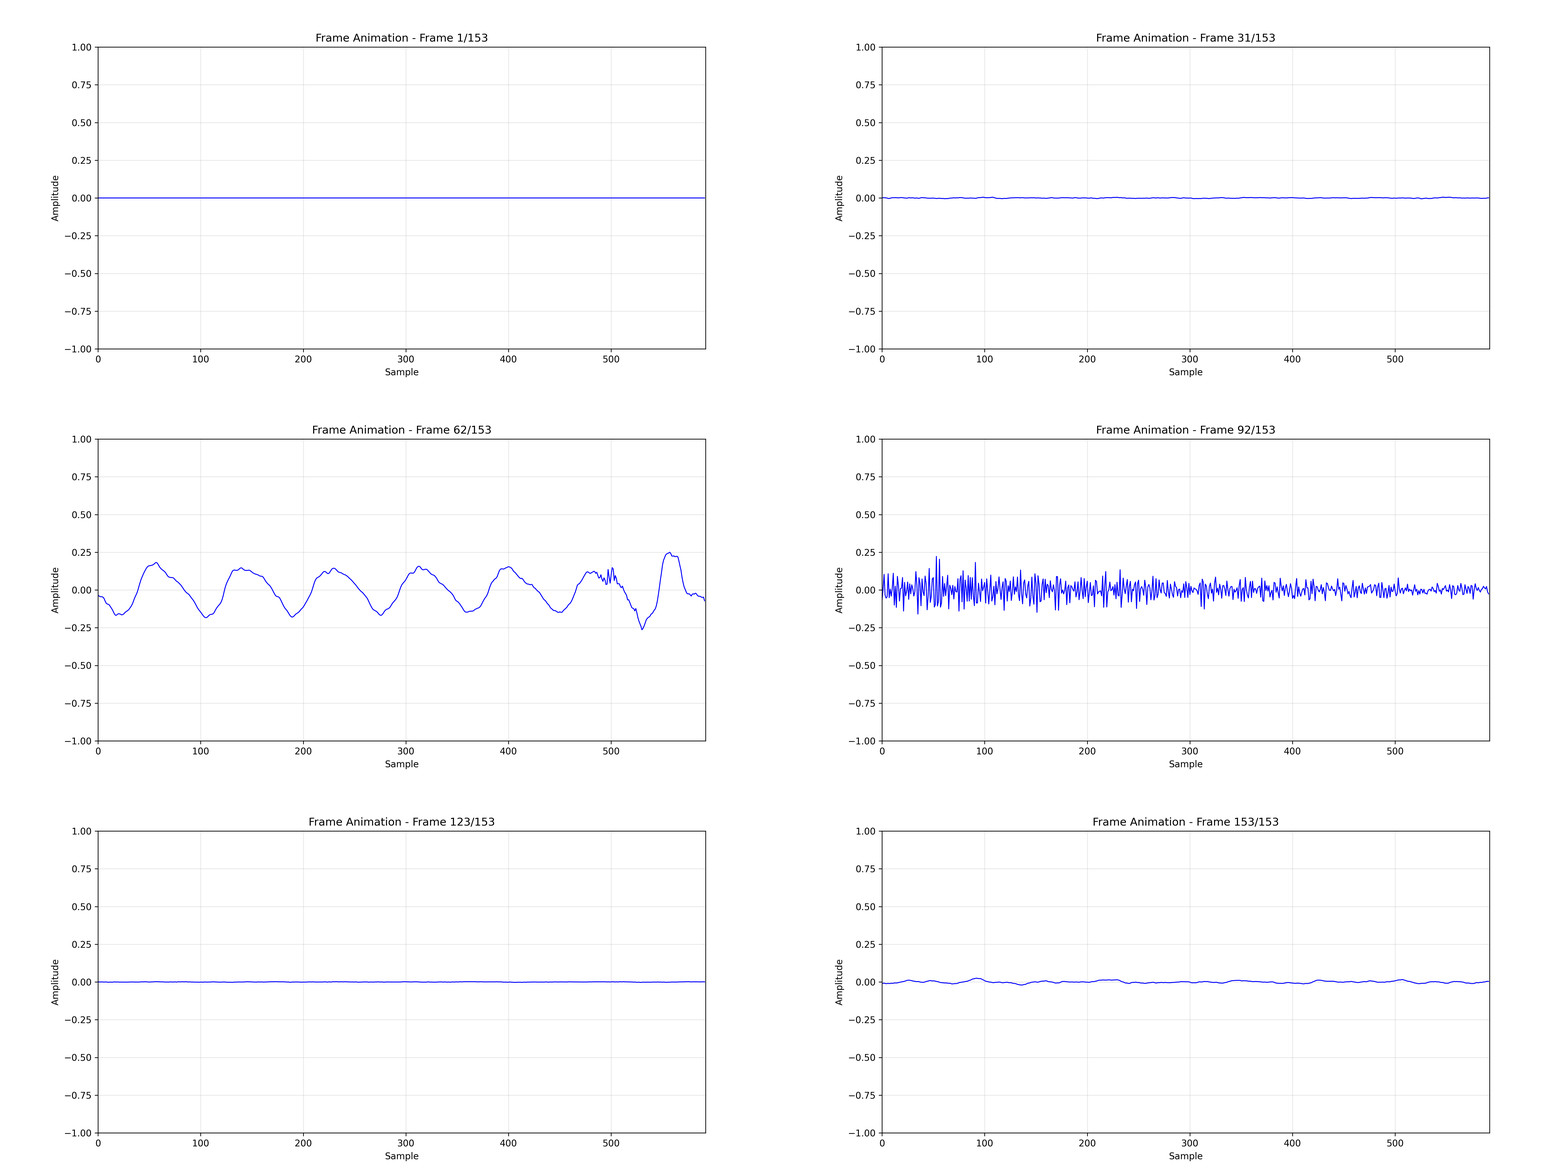
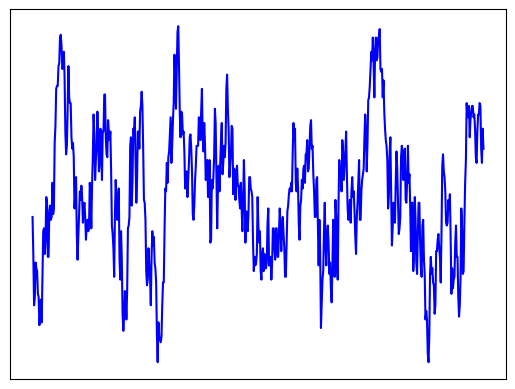
- Audio is split into 10ms frames using a sliding window.
Frame Sequence Visualization:
Single Frame Example:
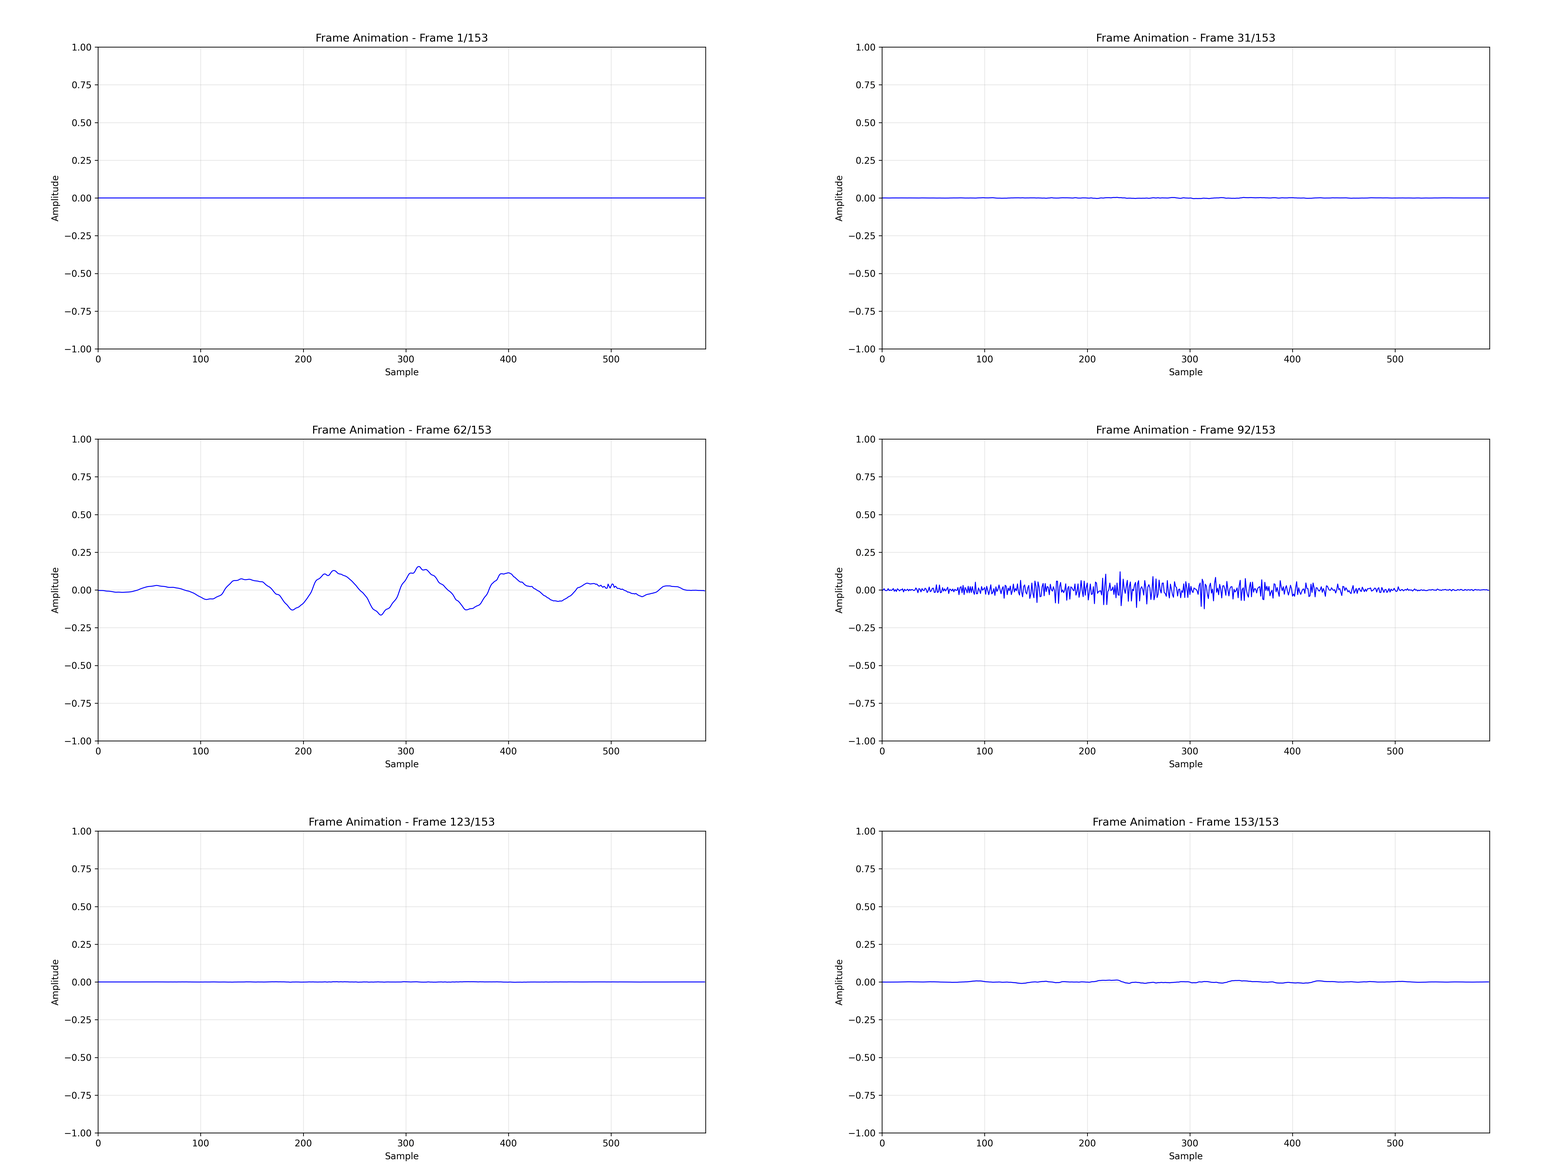
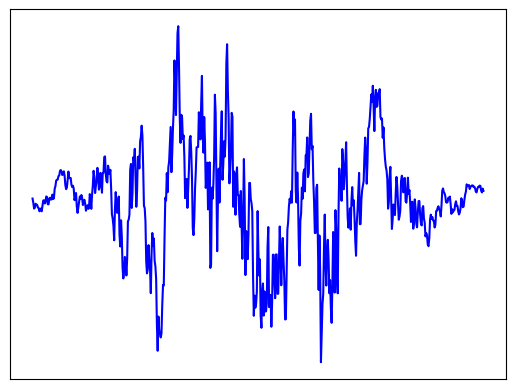
- Reduces spectral leakage by smoothing frame edges.
Window Function:
Windowed Frame Sequence:
Windowed Single Frame:
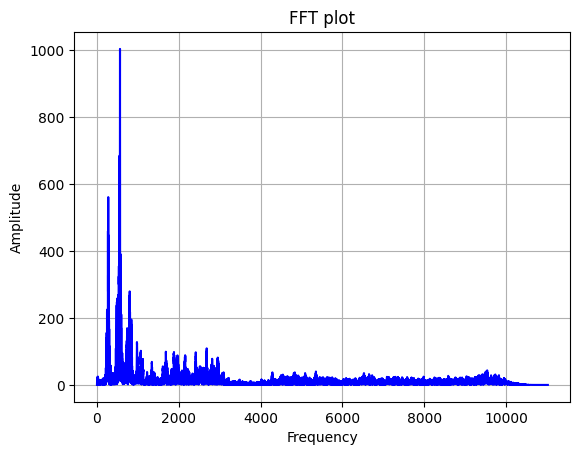
- We apply Fast Fourier Transform (FFT) to convert from time to frequency domain.
Time Domain:
Frequency Domain:
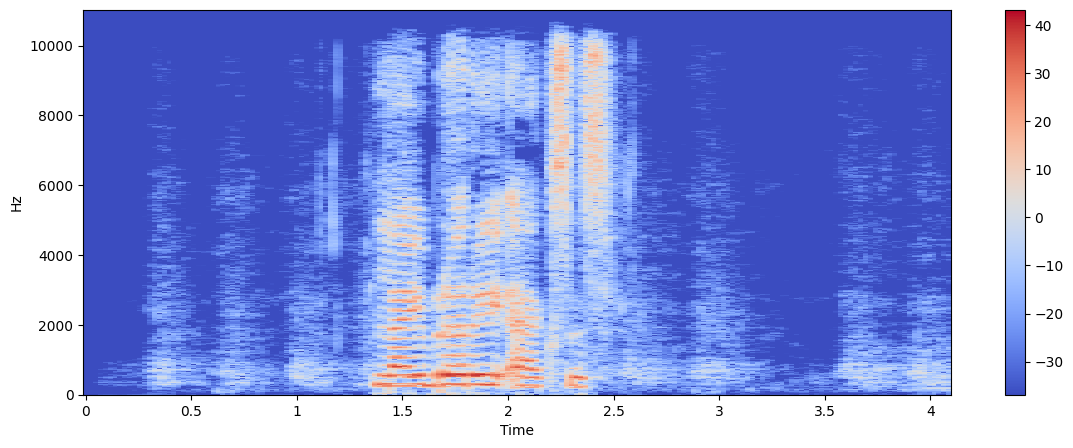
- A spectrogram displays how frequency content changes over time.
Axes:
- X-axis: Time
- Y-axis: Frequency
- Color: Amplitude (Power in dB)
Spectrogram:
-
MFCCs capture perceptual characteristics of audio relevant to human hearing.
-
Widely used in speech recognition.
-
Frequency perception is:
- Linear < 1kHz
- Logarithmic > 1kHz
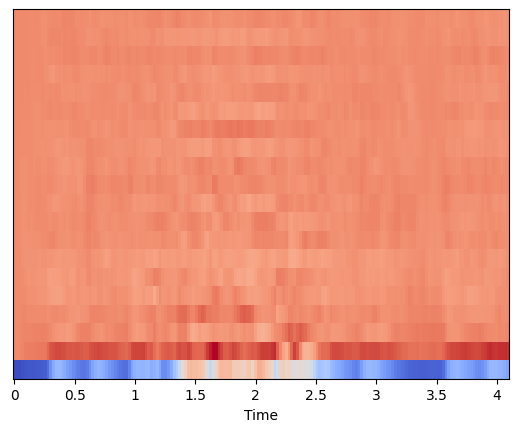
Axes:
- X-axis: Time
- Y-axis: MFCC coefficients (12 in our case)
MFCC Plot:
- Audio can be partially reconstructed from MFCCs with acceptable quality loss.