Visualize your own C/C++ data structures as live tables while debugging with GDB.
Debug Inspector turns the in-memory data structures of your program — threads, semaphores, mutexes, queues, linked lists, or any collection of structs — into clean, sortable tables in a VS Code panel, refreshed every time the debugger stops. You describe what to walk in a small JSON file; the extension knows nothing about your types, so it works with any C/C++ codebase: bare-metal, a hobby or commercial RTOS, or plain application code. It is config-driven and read-only — it never writes your program's memory.
Repository: https://github.com/nothing-githb/debug-inspector

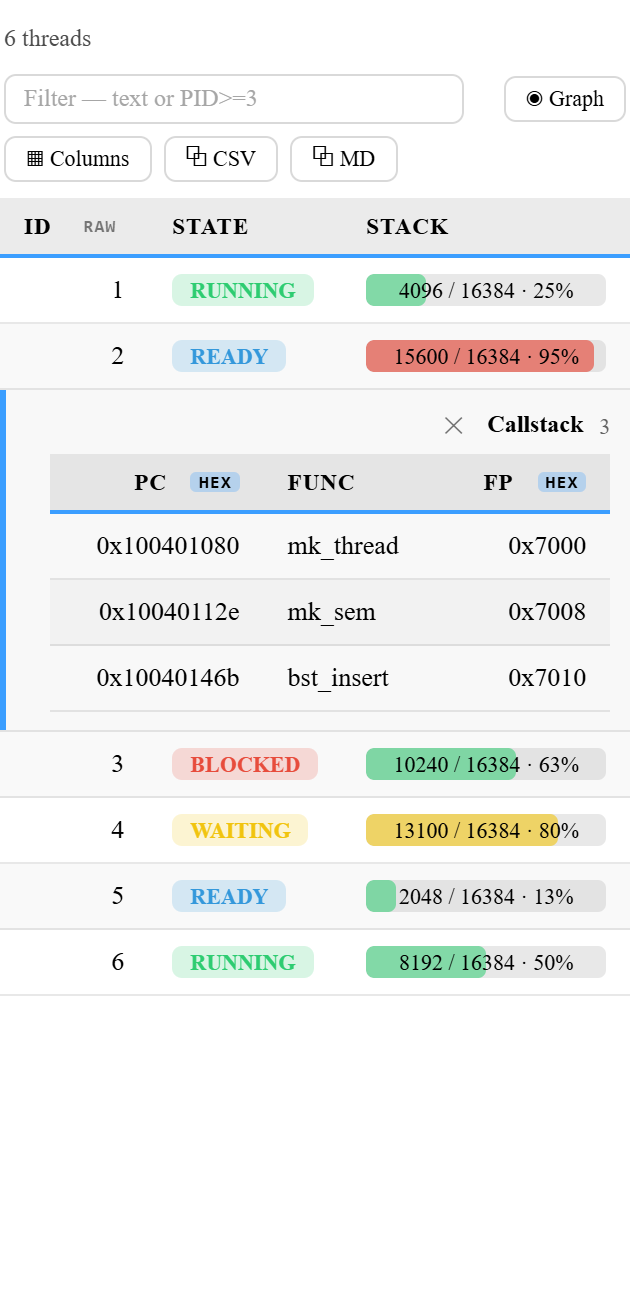
Representative panel — per-process threads with State badges, stack‑usage bars, an Owner cross‑reference link, change highlighting, and per‑column number‑base / sort controls.
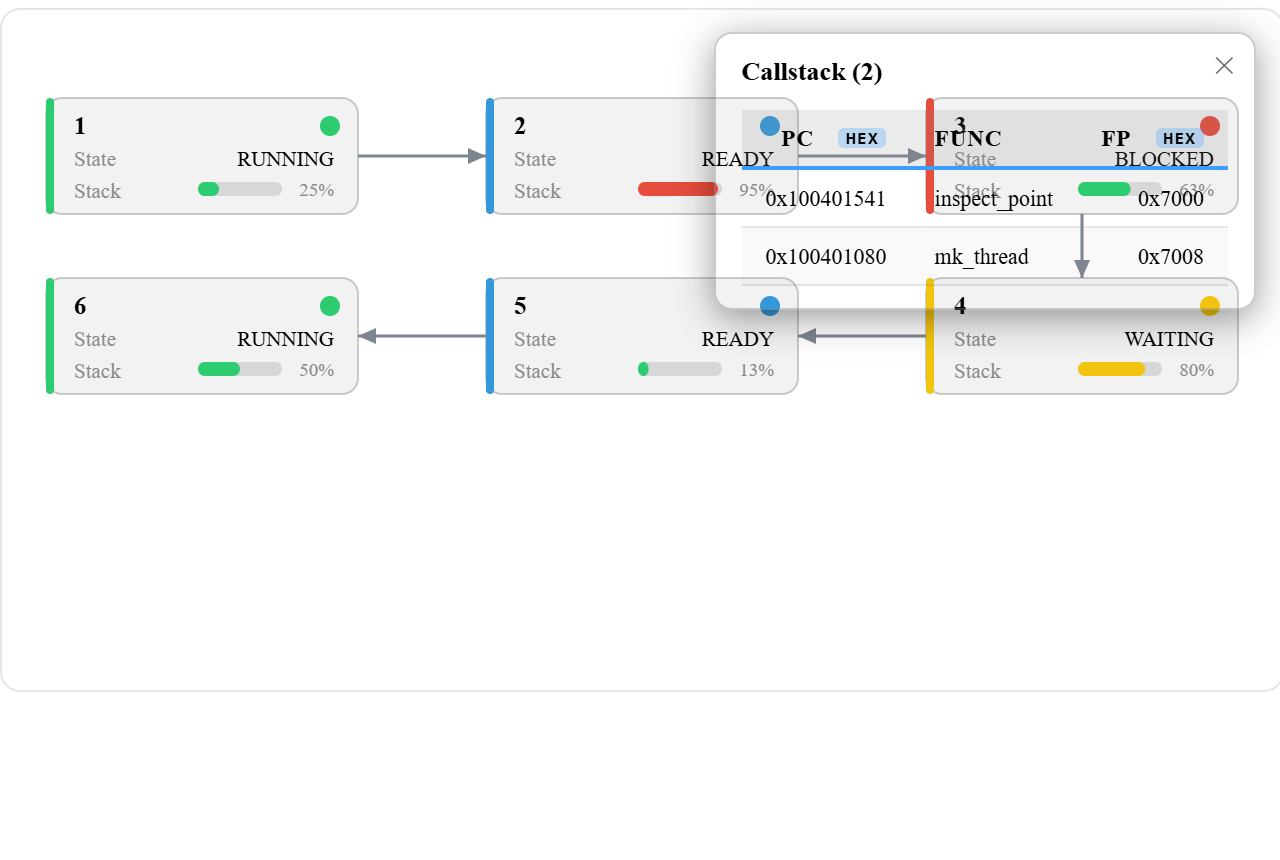
Toggle any section to an interactive node graph. Linked lists and arrays flow as a serpentine grid with arrowed edges; tree structures render as a top-down hierarchy. Cards size to their content, colour‑code state, draw usage bars, and show value‑mapped labels — with pan/zoom, node dragging, search, cross‑section links, and a minimap.

A linked thread list as a node graph: per‑state colour stripes/dots, stack‑usage bars, and arrowed next edges in a serpentine layout.

A binary search tree as a hierarchy: edges leave each parent's bottom‑centre and enter each child's top‑centre.
- Debug a C/C++ program with GDB (
type: cppdbg). - Drop a
debug-inspector.jsonat your workspace root naming one section per structure (e.g. alinked_listrooted atg_thread_list). - Run "Debug Inspector: Open Panel".
- Hit a breakpoint — every section appears as its own sortable table tab, and cells that changed since the last stop light up amber. Press continue and the panel re-reads on the next stop.
- Config-driven & generic. Point a section at any global expression — no assumptions about your layout, no changes to your program.
- One tab per structure. Each named section becomes its own table; tabs are generated dynamically and ordered as they appear in the file.
- Six traversal modes.
linked_list(head pointer +nextfield),array(countelements with./->access),index_list(a list living inside an array, linked by a next-index field — empty slots skipped),tree(walk a tree fromrootby its child pointers —childrendefaults to["left","right"]— drawn as a hierarchical tree in the graph view),walk(a condition-bounded cursor unwind — e.g. a frame-pointer call-stack walk — that starts atstartand advances while awhilepredicate holds), andnested_array(an N-level array — e.g.struct_my* array[core_count]witharray[i][j].array2[k]— via alevels[]list with named levels:${core_index},${job}.name). - Grouping (tree). Relate sections: a section can show, in its own tab, as a
collapsible tree grouped under a master section (
groupBy+${master}) — e.g. every process's semaphores under its process node — all at once, with a Flat-view toggle and a one-click Collapse all / Expand all control. - Graph view. Toggle any section to an interactive node graph with ◉ Graph
(and back with ▤ Table). Linked/index lists flow as a serpentine grid along
their
nextrelationship; grouped sections as per-group swimlane columns (label on top, members beneath); arrays as a card grid. Cards show the title, fields, state colour and usage bar, and size their width to the section's content (compact for short values, wider for long ones, uniform within a section). Hover highlights a node's neighbours, click opens a details panel (decodesbadge/valueMap/flagstext and colours like the cards, with the raw integer in parentheses, and grows/wraps so nothing is cut), drag a node to reposition it (the placement is remembered and follows the row across refreshes), drag the background to pan, scroll to zoom, and ⤢ Fit to recentre. When a section has cross-references, a ⇄ Links toggle overlays purple links to the linked rows in other sections (deduplicated; click a target to jump to it). A Find box spotlights matching nodes — by text or a field test likecount>=3/state=running(operators> >= < <= = !=, combinable), with Enter / Shift+Enter to cycle — and a ◉ Map minimap helps you navigate large graphs (its shape tracks the graph's aspect ratio, so a tall graph gets a tall map and a wide one a short map). Grouped sections pack their groups into a balanced grid; drag a group's header to move the whole block, or right-click a group → Collapse group to fold its members away (shares the table's collapse state). Cards show all of a section's visible fields. Right-click a node to copy it as a watch expression. The ⇄ Links layer shows both outgoing and incoming cross-section links (e.g. which mutexes own a thread).treesections render as a hierarchical tree with edges running from each parent's bottom into each child's top. Drag nodes anywhere — the canvas grows in every direction and shrinks back. From the table, right-click a row → Show in graph to jump to its node. - Usage bars. Render a numeric field as a
used / max · %bar (green → amber → red) with a field's"bar"— e.g. per-thread stack usage. - Cross-reference links. A field with
"link"renders as a clickable link to another object; clicking jumps to that section and highlights the matching row (e.g. a mutex'sOwner→ the owning thread). - Conditional fields. A field with
"when"only shows when its condition holds (else the cell is blank) — combine several on one discriminator for tagged‑union / variant rows (e.g.Ownerwhen locked, elseWaiting). - Edit values (opt-in). Mark a field
"editable": true, then right-click a cell → Edit value… to write it in the running program (GDBset var). Read-only otherwise; any cell can also be copied. - Hide columns by default. Mark a field
"hidden": trueto start it collapsed (and unfetched) until you enable it from the ▦ Columns menu. - Manage sections (tabs). Hide/show whole sections from the ▤ Sections
menu and reorder by dragging a tab (or a row in the menu) — instant
(client-side), remembered per workspace. A section can also start hidden with
"hidden": truein config. - Arbitrary root expressions — anything valid in GDB, e.g.
g_kernel.pools[0]->thread_list. - Generic
void*buffers. Reinterpret an untyped buffer as a typed array withcast, or transform each element before field access withwrap(cast a pointer, hop through a field, deref). - Live updates on every stop, with a
running…badge while the program runs and apausedpill when paused. - Sortable columns — numeric/hex sorts numerically, text sorts alphabetically.
- Filter & changed-only — a per-tab filter box narrows rows as you type
(focus-preserving): plain text, or a field test like
PID>=3/state=running(operators> >= < <= = !=, combinable); a Changed toggle shows only rows that moved since the last stop. - Copy out & export — copy the (filtered) table as CSV or Markdown with
one click (grouped tables add a
Groupcolumn), or ⤓ JSON in the top bar to export every section's data to a JSON file. - Per-column number base — show any numeric column as dec / hex / bin via
a click-to-cycle base button in the column header's top-right
(
raw→bin→dec→hex), or set a default in config with a field's"base". Numeric columns are right-aligned with tabular figures. - Sticky header & full-value tooltips — the header stays put on vertical scroll, and hovering any cell shows its full value in a tooltip.
- Change highlighting — changed cells are amber, with the previous value shown
faded and struck-through next to the new one, plus an
N changedbadge. - Pick & reorder columns — drag a header (blue drop indicator + drag-preview chip) or drag rows in the ▦ Columns menu; show/hide via the menu or a header right-click. Hidden columns are not read from GDB at all; enabling one fetches it on the spot. Saved per workspace.
- Refresh on demand or on change — a Refresh button does a one-shot read, and the panel auto-refreshes when the config file changes on disk.
- Pause / Resume — stop the auto-refresh-on-stop (and the GDB queries it makes); Refresh still works on demand. Remembered per workspace.
- Read-only & safe — it only reads your globals via
print, and never calls your functions. The onlysetcommands it issues target its own$-prefixed GDB convenience-variable cursors, never your memory. - Tidy strings & empties — fixed-size
chararrays are shown only up to the first\0(trailing NULs /'\000' <repeats N times>dropped); an unreadable/inaccessible value or a NULL pointer (0x0) shows as a muted-; a plain integer0stays0. - Leveled, color-coded logs — a Debug Inspector Output channel (rendered
with the
loglanguage so timestamps/severities are colorized); pickoff/info/debug.
- The C/C++ extension
(
ms-vscode.cpptools) and a working GDB debug configuration (type: cppdbg). - GDB available on your system.
- From the Marketplace: search for Debug Inspector, or open
the listing
(
itemName=halistahasahin.debug-inspector). - From a packaged build:
code --install-extension dist/debug-inspector-<version>.vsix(or in VS Code: Extensions → ⋯ → Install from VSIX…).
- Debug your C/C++ program with
cppdbg(GDB). - Put a
debug-inspector.jsonat your workspace root (see the schema below). - Run "Debug Inspector: Open Panel" from the Command Palette.
- When you hit a breakpoint the panel fills in; on continue it shows
running…and refreshes again on the next stop.
Debug Inspector registers a debug adapter tracker for the configured debug
types and listens for stopped / continued events. On stop (unless paused) it
grabs the top stack frame and reads your data read-only by issuing
-exec print … through the debug adapter's evaluate request, then strips
GDB's $N = / prompt noise from each result. Each section is walked according to
its mode:
- linked_list seeds a GDB convenience-variable cursor (
set $ri_<i> = root), reads fields off the cursor, then advancesset $ri_<i> = $ri_<i>->nextuntil the cursor is NULL. - array indexes a base expression
0…min(count, max). - index_list starts at
head, readsroot[idx], then follows thenextindex until it hitsnil. - tree does a breadth-first walk from
rootover each node'schildrenpointer fields (defaultleft/right), skipping NULL/unreadable subtrees and already-visited addresses (cycle guard); the graph view lays it out as a tree. - walk starts a cursor at
start(orroot), emits a row, advances the cursor via thenexttemplate, and continues while thewhileboolean template is true — stopping on a NULL/unreadable cursor, a repeated cursor (cycle), or no forward progress. Fields/templates use${expr}(the raw cursor) or${wrapped_expr}(the cursor after an optionalcast/wrap).
Only the currently visible columns are fetched, so hidden columns cost
nothing. Rows are also rendered progressively — they appear as each is read
from GDB (under a ⟳ Loading… banner) rather than all at once when the section
finishes, so large/grouped sections stay responsive.
The config file (default debug-inspector.json) is a JSON map of named
sections. Each key whose value is an object with a string mode and an array
fields is a section; the key is its tab label. Keys starting with // are
ignored (handy for inline notes). Section order is preserved and drives tab
order.
Every field, across all modes:
| Field | Modes | Default | Meaning |
|---|---|---|---|
mode |
all | — (required) | "linked_list", "array", "index_list", "tree", "walk", "nested_array" (N-level array via levels[]; naming a level "core" yields ${core}/${core_index} tokens; part exprs accept accessor / constant / ${expr} template / ::global). Selects the traversal. |
root |
most | — (required) | Starting expression in your program's own syntax (head pointer, array, buffer, or tree root). May contain ${master} (grouping). For walk, use start instead — root is only a fallback when start is omitted. |
children |
tree | ["left","right"] |
Child-pointer field names followed from each node (BFS). The graph view lays the result out as a hierarchical tree. |
fields |
all | — (required) | Ordered list of { "label", "expr" } columns. label is the header (and first column = row identity); expr is the accessor appended after the element, OR a computed expression using ${expr} / ${wrapped_expr} (the element, like wrap/next) — e.g. "${expr}->stack_size - ${expr}->stack_used" for arithmetic across two members. A field may add "hidden": true (start collapsed), "base": "dec"|"hex"|"bin" (default number base), "bar": { "max": "<expr>", "warn": 75, "crit": 90 } (render as a usage bar), and/or "link": { "section": "<target>", "match": "<column>" } (clickable cross-reference — jump to the target row whose match column equals this value; match defaults to the target's first column), and/or "when": "<bool expr>" (conditional field — blank when false; several on one discriminator make a variant/tagged‑union), "editable": true (right‑click → Edit value… writes via GDB set var; assignable fields only), "wrap": "<tmpl>" (transform the field value after access — ${expr} = the accessed value, e.g. expr:"data" + wrap:"((widget_t *)${expr})->x"), and/or "badge": { "<value>": "<color>" } (value→color badge — names like green/red/amber/cyan or #rrggbb — overriding the built‑in State coloring), and/or "valueMap": { "<value>": "<text>" | { "text", "color" } } (render a value as custom text + color — the text‑changing superset of badge; applies in the table cell and the graph card), "flags": { "<mask>": "<name>" | { "text", "color" } } (decode a bit-flag integer to named flags by mask), and/or "symbol": true (treat the value as a code address and show its function+offset via GDB print/a — e.g. a callstack PC → function name; unresolved addresses stay as the address), and/or "sourceLine": true (resolve a code address to its source file:line via GDB info line — click the cell to open it in the editor; blank if built without -g). |
next |
linked_list, index_list, walk | — (set it) | linked_list: the pointer field to the next node (used as cursor->next). index_list: the field holding the next index, OR a ${expr} template that computes it (like wrap — ${expr} is the element; e.g. "${expr}.link.idx" or "g_succ[${expr}.id]"). walk: a template that computes the next cursor from the current one — ${expr} is the current raw cursor value (e.g. "*(unsigned long *)(${expr})"), or ${wrapped_expr} when a cast/wrap is set (e.g. "${wrapped_expr}->prev"). The traversal uses this verbatim, so set it; it is only assumed to be next when building a grouped master's selector expression. |
head |
index_list | — | Starting index expression, read once. May contain ${master} (grouping). |
nil |
index_list | -1 |
Sentinel index that ends the walk. May contain ${master} (grouping). |
count |
array | — (required for array) | Expression giving the element count; read once per refresh. If it can't be read it's treated as 0 (empty table). May contain ${master} (grouping). |
access |
array, index_list, walk | . |
Accessor between element and field — "." for a value element, "->" for a pointer. (linked_list always uses ->.) In walk it applies to the default field path over ${wrapped_expr}. |
cast |
array, index_list, walk | — | Cast — write it in full (no * is appended for you). array/index_list: reinterprets the untyped root buffer. walk: types the cursor, so ${wrapped_expr} = ((cast)(cursor)) and you read ${wrapped_expr}->member instead of raw pointer math. |
wrap |
all | — | Template that transforms the element before field access; ${expr} = the element. In walk it wraps the (cast-typed) cursor to form ${wrapped_expr}; ${expr} there stays the raw cursor value, so next/while bounds math is unaffected. |
label |
master sections | row key | Expression titling each tree node when another section groups by this one. |
groupBy |
grouping sections | — | Name of a master section; renders this section as a tree in its own tab. Use ${master} in root. |
selectedFrom |
detail sections | — | Name of a master section; makes this an on-demand detail (not a tab). Right-click a master row/node → Show … (detail) to build it for that one element; ${selected} (in this section's traversal expressions — root/start/next/while/head/nil/count/wrap — and any field expr/wrap/when/bar; not cast) is the selected element's stable expression. |
start |
walk | — | Initial cursor (address/value). ${expr} in next/while/fields is the current cursor. |
while |
walk | — | Boolean ${expr} template; the walk continues while true and stops when false. |
hidden |
all | false |
Start this section's tab hidden (until you show it from the ▤ Sections menu). Ignored once you change section visibility in the UI. |
max |
all | 1024 |
Traversal upper bound (array loop cap; cycle/length guard for the lists). |
cast is applied to root to form the base, as you wrote it — no trailing
* is added. The base becomes ((cast)(root)) and elements index off it:
cast: "widget_t *", root: "g_widgets.data" → ((widget_t *)(g_widgets.data))[i]
wrap rewrites each element before its fields are read. ${expr} is the
element; the element is parenthesized into the template, and the whole wrap
output is parenthesized again before the access is appended. So with element
g_slots[i] and access: "->":
wrap: "((widget_t *)${expr})" → (((widget_t *)(g_slots[i])))->field
The extra outer parens fix precedence — a deref wrap "*(${expr})" yields
(*(elem)).field rather than the mis-parsed *(elem).field. wrap composes
with cast: cast is applied to root to form the element, then wrap
wraps that element. To reach the real data through a field first (each slot
is a { void *data; … } wrapper), do the hop inside the wrap so it happens
before the cast:
wrap: "((widget_t *)(${expr}.data))", access: "->" → ((widget_t *)(g_boxes[i].data))->field
Used in a section that sets groupBy. For each element of the master section,
${master} is substituted (in parentheses) into this section's root, count,
head, and nil, producing one group per parent. It resolves to the master
row's fully processed element — its own cast and wrap re-applied — so no
address-taking or extra cast is needed.
On a master section, label is an expression evaluated on the master element to
title each node in a grouped child. A char* rendered by GDB as 0x.. "init" is
shown as just init. If a grouped child's master has no label, the group's key
(the master row's first-column value) is used instead.
linked_list — head pointer + next field. Seeds a cursor at root, reads
fields, advances cursor = cursor->next, stops at NULL (0x0 or empty) or max.
"processes": {
  "mode": "linked_list",
  "root": "g_process_list",
  "next": "next",
  "label": "name",
  "fields": [
    { "label": "PID",  "expr": "pid" },
    { "label": "Name", "expr": "name" }
  ]
}
array — count elements off root (cast-aware), indexed 0…min(count, max),
with ./-> access. No NULL/sentinel logic.
"timers": {
  "mode": "array",
  "root": "g_timers",
  "count": "g_timer_count",
  "access": ".",
  "fields": [
    { "label": "ID",      "expr": "id" },
    { "label": "Name",    "expr": "name" },
    { "label": "Period",  "expr": "period" },
    { "label": "Elapsed", "expr": "elapsed" },
    { "label": "Active",  "expr": "active" }
  ]
}
index_list — a list inside an array, linked by an integer index. Start at
head, read root[idx], follow next (the next index) until it equals nil
(default -1). Slots that aren't on the chain are never visited. A visited-set
breaks cycles, and max bounds the length.
"pool": {
  "mode": "index_list",
  "root": "g_slot_pool",
  "head": "g_slot_head",
  "next": "next",
  "nil": "-1",
  "access": ".",
  "fields": [
    { "label": "ID",   "expr": "id" },
    { "label": "Name", "expr": "name" },
    { "label": "Next", "expr": "next" }
  ]
}
With the chain 0 → 2 → 5 this shows three rows; slots 1/3/4 are skipped
because they are not on the chain.
If the next index isn't a plain field, next may be a ${expr} template
(like wrap) — e.g. "next": "${expr}.link.idx", or a lookup
"next": "g_succ[${expr}.id]". Two placeholders are available:
${expr}— the un-wrapped element (the same${expr}thatwrapreceives, so it means the same thing in both places).${wrapped_expr}— the element aftercast/wrap, so you can reuse the cast without rewriting it: withwrap: "((node_t *)${expr})", write"next": "${wrapped_expr}->nxt".
Without either placeholder, next stays the simple element<access>next (using
the wrapped element).
tree — walk a tree from root, following each node's child pointers.
children lists the child-pointer field names (default ["left","right"]); a
NULL child ends that branch. The graph view draws it as a hierarchical tree
(root on top, children below, edges from each parent's bottom into each child's
top); the table view lists the nodes.
"btree": {
  "mode": "tree",
  "root": "g_tree_root",
  "children": ["left", "right"],
  "fields": [
    { "label": "Key",   "expr": "key" },
    { "label": "Label", "expr": "label" }
  ]
}
children isn't limited to two — list as many child-pointer fields as the node
has (e.g. ["first_child","next_sibling"] for an n-ary tree). Each is followed
from every node; an again-visited guard keeps the walk finite, and unreadable or
NULL children stop that branch.
walk — a condition-bounded cursor unwind for sequences that aren't a
plain array or next-pointer list (classic case: a call stack unwound by
frame pointers). A cursor starts at start; each step reads fields with
${expr} = the current raw cursor (and ${wrapped_expr} = that cursor after
an optional cast/wrap), then next computes the next cursor; it continues
while while (a boolean template) is true (plus max and a
no-progress/cycle guard). Terminates on a predicate, not a sentinel/count.
Read-only. Either do the pointer math yourself over ${expr}, or add a cast
(e.g. "frame_t *") and read typed members via ${wrapped_expr}->member:
Data worth seeing for one element at a time — a thread's call stack, a node's
sub-list — should be a detail, not a tab. Give the section selectedFrom: "<master>"; nothing is fetched until you right-click a master row (table) or
node (graph) and choose Show … (detail). ${selected} resolves to that
element's stable expression, and the detail is re-fetched on every stop while
it's open (close it from the ✕ in its header). In the table it expands as an
accordion right below the selected row; in the graph the detail panel opens and
widens to hold it. It pairs with walk for a per-thread call stack — the example
above, but "selectedFrom": "threads" and "start": "${selected}->cs_fp", so
right-clicking a thread unwinds its stack. Independent of the master's mode; a
master may expose more than one detail.
Relate one section to another: set groupBy to a master section's name and use
${master} in root, and this section renders in its own tab as a
collapsible tree of all master elements at once. The master's label titles
each node.
{
  "processes": {
    "mode": "linked_list", "root": "g_process_list", "next": "next",
    "label": "name",
    "fields": [ { "label": "PID", "expr": "pid" }, { "label": "Name", "expr": "name" } ]
  },
  "semaphores": {
    "groupBy": "processes",
    "mode": "linked_list", "root": "${master}->sem_list", "next": "next",
    "fields": [
      { "label": "ID", "expr": "id" }, { "label": "Count", "expr": "count" },
      { "label": "Max", "expr": "max_count" }, { "label": "Waiting", "expr": "waiting" },
      { "label": "Discipline", "expr": "discipline" }
    ]
  }
}
The Semaphores tab lists each process as a collapsible node (caret + count badge)
with its semaphores beneath, titled by the process name. A ☰ Flat view
toggle switches to a single ungrouped table of all rows. Grouping also works with
index_list and a per-parent head:
"procSlots": {
  "groupBy": "processes",
  "mode": "index_list",
  "root": "g_slot_pool",
  "head": "${master}->slot_head",
  "next": "next",
  "nil": "-1",
  "access": ".",
  "fields": [ { "label": "ID", "expr": "id" }, { "label": "Name", "expr": "name" } ]
}
Every grouped section populates on each stop with no clicking — all parents and their children are shown at once.
When a container stores its elements behind a void * buffer (a dynamic array),
give the element type with cast so the buffer can be indexed. For a buffer of
pointers, set cast to the pointer type and access to "->".
"widgets": {
  "mode": "array",
  "root": "g_widgets.data",
  "count": "g_widgets.size",
  "cast": "widget_t *",
  "access": ".",
  "fields": [
    { "label": "X", "expr": "x" }, { "label": "Y", "expr": "y" },
    { "label": "Label", "expr": "label" }
  ]
}
This reads each element as ((widget_t *)(g_widgets.data))[i].field.
For an array of pointers (void *g_slots[3], each a widget_t*), cast the
element inside wrap and use ->:
"slots": {
  "mode": "array",
  "root": "g_slots",
  "count": "3",
  "wrap": "((widget_t *)${expr})",
  "access": "->",
  "fields": [
    { "label": "X", "expr": "x" }, { "label": "Y", "expr": "y" },
    { "label": "Label", "expr": "label" }
  ]
}
→ (((widget_t *)(g_slots[i])))->x.
For a field-first hop (box_t g_boxes[3], each { void *data; int kind }),
reach .data inside the wrap before casting:
"boxes": {
  "mode": "array",
  "root": "g_boxes",
  "count": "3",
  "wrap": "((widget_t *)(${expr}.data))",
  "access": "->",
  "fields": [
    { "label": "X", "expr": "x" }, { "label": "Label", "expr": "label" }
  ]
}
→ ((widget_t *)(g_boxes[i].data))->x.
cast / wrap / access work exactly as in array mode. Write nil the way
GDB prints the index (usually decimal). A visited-set and the max bound guard
against cycles and runaway chains.
Give a numeric field a bar and it renders as a horizontal used / max · NN%
bar, colored green → amber (≥ warn %) → red (≥ crit %). bar.max is a sibling
expression on the same element (e.g. stack_size) or a constant; warn / crit
default to 75 / 90. The field's own expr is the used value.
{
  "threads": {
    "groupBy": "processes",
    "mode": "linked_list", "root": "${master}->thread_list", "next": "next",
    "fields": [
      { "label": "ID", "expr": "id" },
      { "label": "Name", "expr": "name" },
      { "label": "Stack", "expr": "stack_used", "bar": { "max": "stack_size", "warn": 75, "crit": 90 } }
    ]
  }
}
This shows each thread's stack usage as stack_used / stack_size. Shorthand:
"bar": "stack_size" (default thresholds).
Any fields entry can carry these — one example each:
// Computed value: ${expr} (raw) / ${wrapped_expr} (after cast/wrap) — arithmetic, casts, ternaries
{ "label": "Free", "expr": "${expr}->stack_size - ${expr}->stack_used" }

// Element index: ${index} = array subscript (array) / slot index (index_list) ONLY.
// Not available in linked_list/tree/walk (no array index there). Substituted anywhere in the expr.
{ "label": "Idx",  "expr": "${index}" }
{ "label": "Name", "expr": "g_names[${index}]" }

// Tree depth: ${depth} = node depth in a tree section (0 = root, 1 = children, ...). Standalone.
// (Trees have no ${index}; ${depth} is the tree's positional keyword.)
{ "label": "Depth", "expr": "${depth}" }

// Master element: in a grouped section (groupBy), ${master} = the master this row belongs to.
// Works in expr/wrap/when (you write the access). Standalone. Used in a non-grouped section -> warning.
{ "label": "Proc", "expr": "${master}->name" }

// Selected element: in a detail section (selectedFrom), ${selected} = the right-clicked master
// element's stable expression. Substitutes in root/start/next/while/head/nil/count/wrap +
// per-field expr/wrap/when/bar (everywhere except cast). Standalone.
{ "label": "FP", "expr": "${selected}->cs_fp", "base": "hex" }

// Symbol: treat the value as a code address; print/a resolves it to func+off (e.g. callstack PC).
// Unresolved addresses stay as the raw address. Read-only (no base/edit/watch).
{ "label": "Func", "expr": "*(unsigned long *)((${expr}) + 8)", "symbol": true }

// Number base: dec / hex / bin default (also a 10/16/2 toggle in the column header)
{ "label": "Handle", "expr": "id", "base": "hex" }

// Cross-reference link: click jumps to the matching row in another section (only if a match exists)
{ "label": "Owner", "expr": "owner", "link": { "section": "threads", "match": "ID" } }

// Conditional / tagged-union: show only when true; several on one discriminator = variant rows
{ "label": "Owner",   "expr": "owner",   "when": "locked" },
{ "label": "Waiting", "expr": "waiters", "when": "${expr}.locked == 0" }

// Editable: right-click -> Edit value writes via GDB `set var` (assignable fields only)
{ "label": "Locked", "expr": "locked", "editable": true }

// Hidden by default: start collapsed + unfetched; enable from the ▦ Columns menu
{ "label": "Next", "expr": "next", "hidden": true }

// Field wrap: transform the value AFTER access (${expr} = the accessed value)
{ "label": "X", "expr": "data", "wrap": "((widget_t *)${expr})->x" }

// Badge colors: map values to colored badges (overrides built-in State coloring); names or #rrggbb
{ "label": "State", "expr": "state", "badge": { "RUNNING": "green", "READY": "cyan", "BLOCKED": "red", "WAITING": "amber" } }

// Value mapping: render a value as custom TEXT + COLOR (text-changing superset of badge).
// Plain string changes just the text; { text, color } changes both. Applies in table + graph card.
{ "label": "Locked", "expr": "locked", "valueMap": { "0": { "text": "free", "color": "#2ecc71" }, "1": { "text": "HELD", "color": "#e74c3c" } } }
{ "label": "Active", "expr": "active", "valueMap": { "0": "idle", "1": "armed" } }

// Bit flags: decode an integer's bits to names. Key = bit mask (hex 0x04 or dec 4); shows set flags
// ((val & mask) == mask). Unmapped bits appended as +0x..; value 0 shows 0.
// Colored pills in the table; on the graph card each flag is drawn in its own color.
{ "label": "Flags", "expr": "flags", "flags": { "0x1": { "text": "BUSY", "color": "amber" }, "0x2": "OWNED", "0x4": { "text": "ROBUST", "color": "green" }, "0x8": "RECURSIVE" } }| Setting | Default | Description |
|---|---|---|
debugInspector.configPath |
debug-inspector.json |
Path to the config file. Absolute paths are used as-is (work even with no workspace folder); a relative path resolves against the workspace root. Changing it re-creates the file watcher. |
debugInspector.logLevel |
info |
Output channel verbosity: off / info / debug. Applied live on change. |
debugInspector.debugTypes |
["cppdbg"] |
Debug adapter types the tracker attaches to. Use cppdbg for GDB. |
- Debug Inspector: Open Panel (
debugInspector.open) — open or reveal the panel; if the debugger is already stopped, it refreshes immediately. - Debug Inspector: Show Log (
debugInspector.showLog) — reveal the Debug Inspector Output channel. - Debug Inspector: Open Config File (
debugInspector.openConfig) — open thedebug-inspector.jsonresolved fromconfigPath(offers to create a starter if it doesn't exist). Also a ⚙ Config button in the panel's top bar; default keyCtrl/Cmd+K Ctrl/Cmd+Iwhen the editor isn't focused (rebind in Keyboard Shortcuts).
Open View → Output → "Debug Inspector" (or run "Debug Inspector: Show Log")
to see what the extension is doing. The channel uses the built-in log language
id so the theme color-codes timestamps, severities, and values; each line is
YYYY-MM-DD HH:MM:SS.mmm [LEVEL] message. Set the level with
debugInspector.logLevel:
off— no logging.info(default) — milestones (activate, refresh, selection) plus warnings/errors, including GDB access failures. Use this when a column comes up empty or aroot/cast/nextdoesn't resolve.debug— everything: per-section resolved traversal and row counts, the resolved${master}, every prepared GDB access string (gdb ▸) and its result (gdb ◂), and a line per traversal step. For anindex_listeach hop is shown asstep N: idx X → next [ root[idx].next ] = "v" → idx N; for alinked_list,node Nper advance — so you can see exactly hownextis resolved at each hop.
When a cell shows a muted -, the underlying value was unreadable (GDB errors
like cannot access memory, optimized out, no symbol) or a NULL pointer
(0x0). The raw value is preserved underneath, so sorting, summaries, and
change-detection still work.
extension/        the extension source (compiled & packaged)
  src/extension.ts
test-workspace/   a small C example + .vscode templates for trying it
dist/             packaged .vsix builds
cd extension
npm install
npm run compile          # tsc -> out/extension.js
npx @vscode/vsce package # produces a .vsix
For live development, open extension/ in VS Code and press F5 to launch an
Extension Development Host.