Performing analysis on Kickstarter data to determine if there is a correlation between Outcomes and Launch Date as well as Outcomes and Goal Amount.
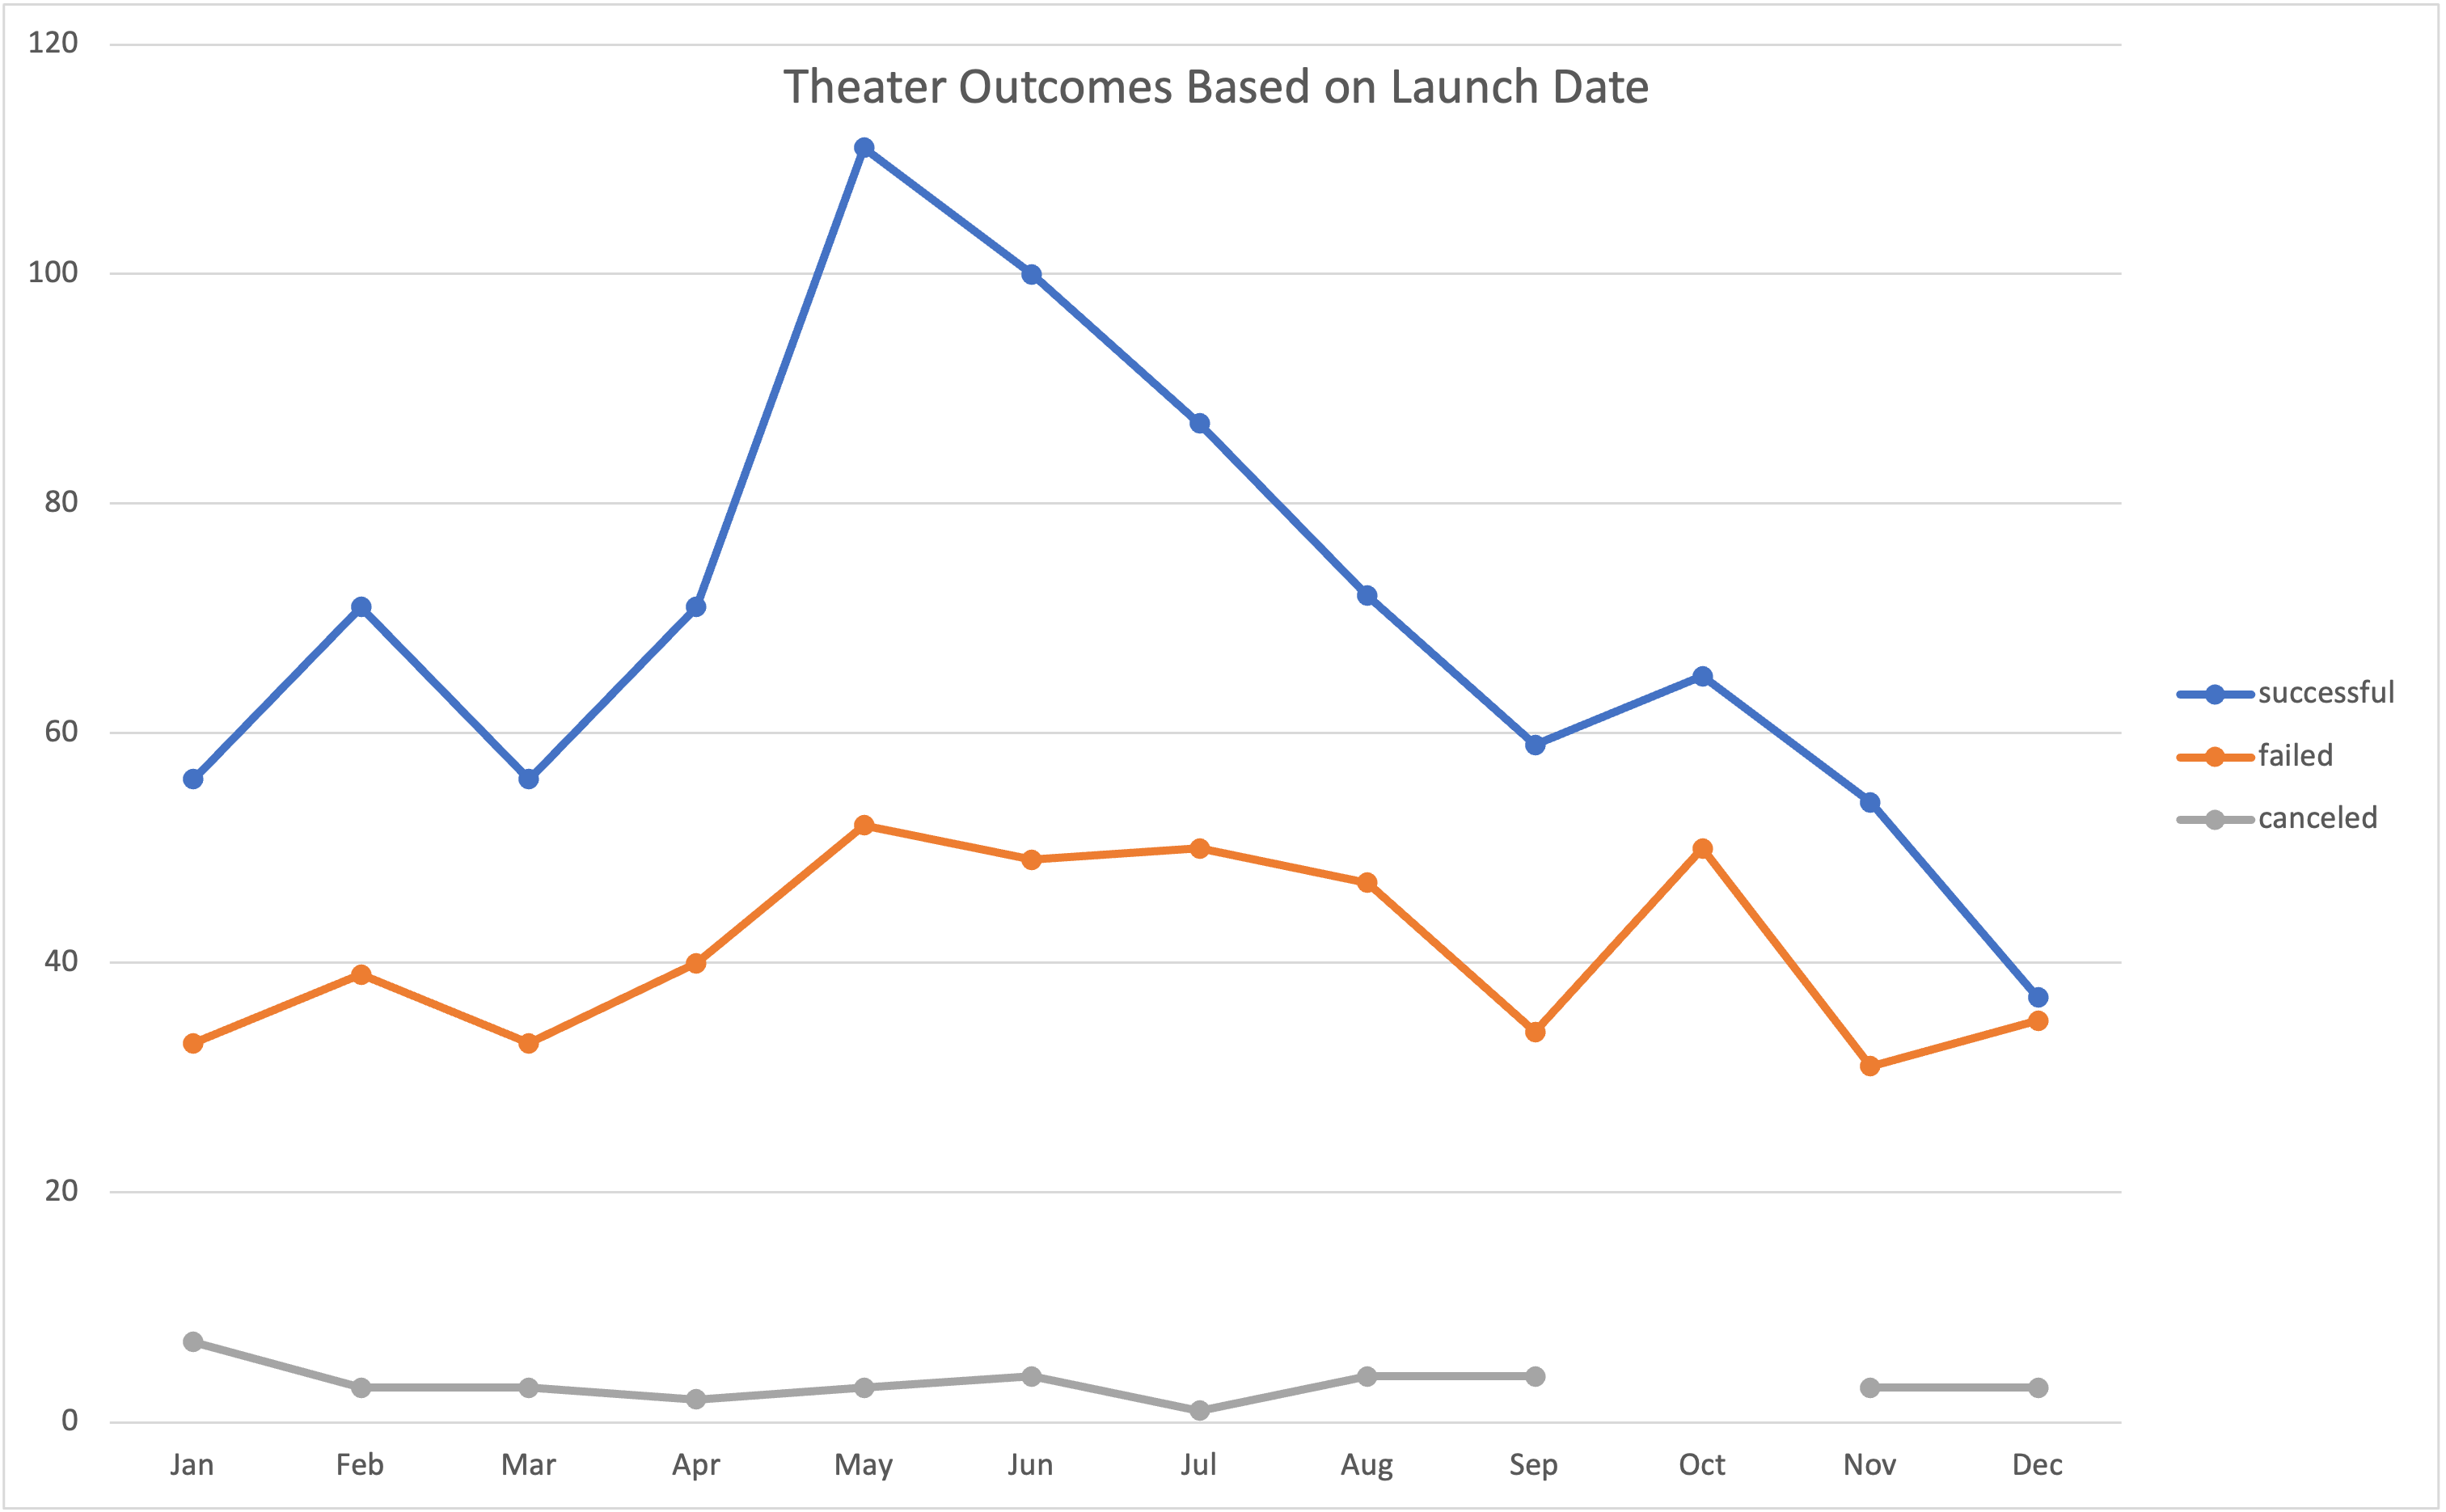
Looking at outcomes based on launch date, we see that the number of successful campaigns increase from January to February before decreasing again going into March. The number then begins to increase again until peaking in May, and ultimately begins to decrease at a steady rate until September. We then see a slight increase moving into October until it again decreases throughout the remaining months of the year.
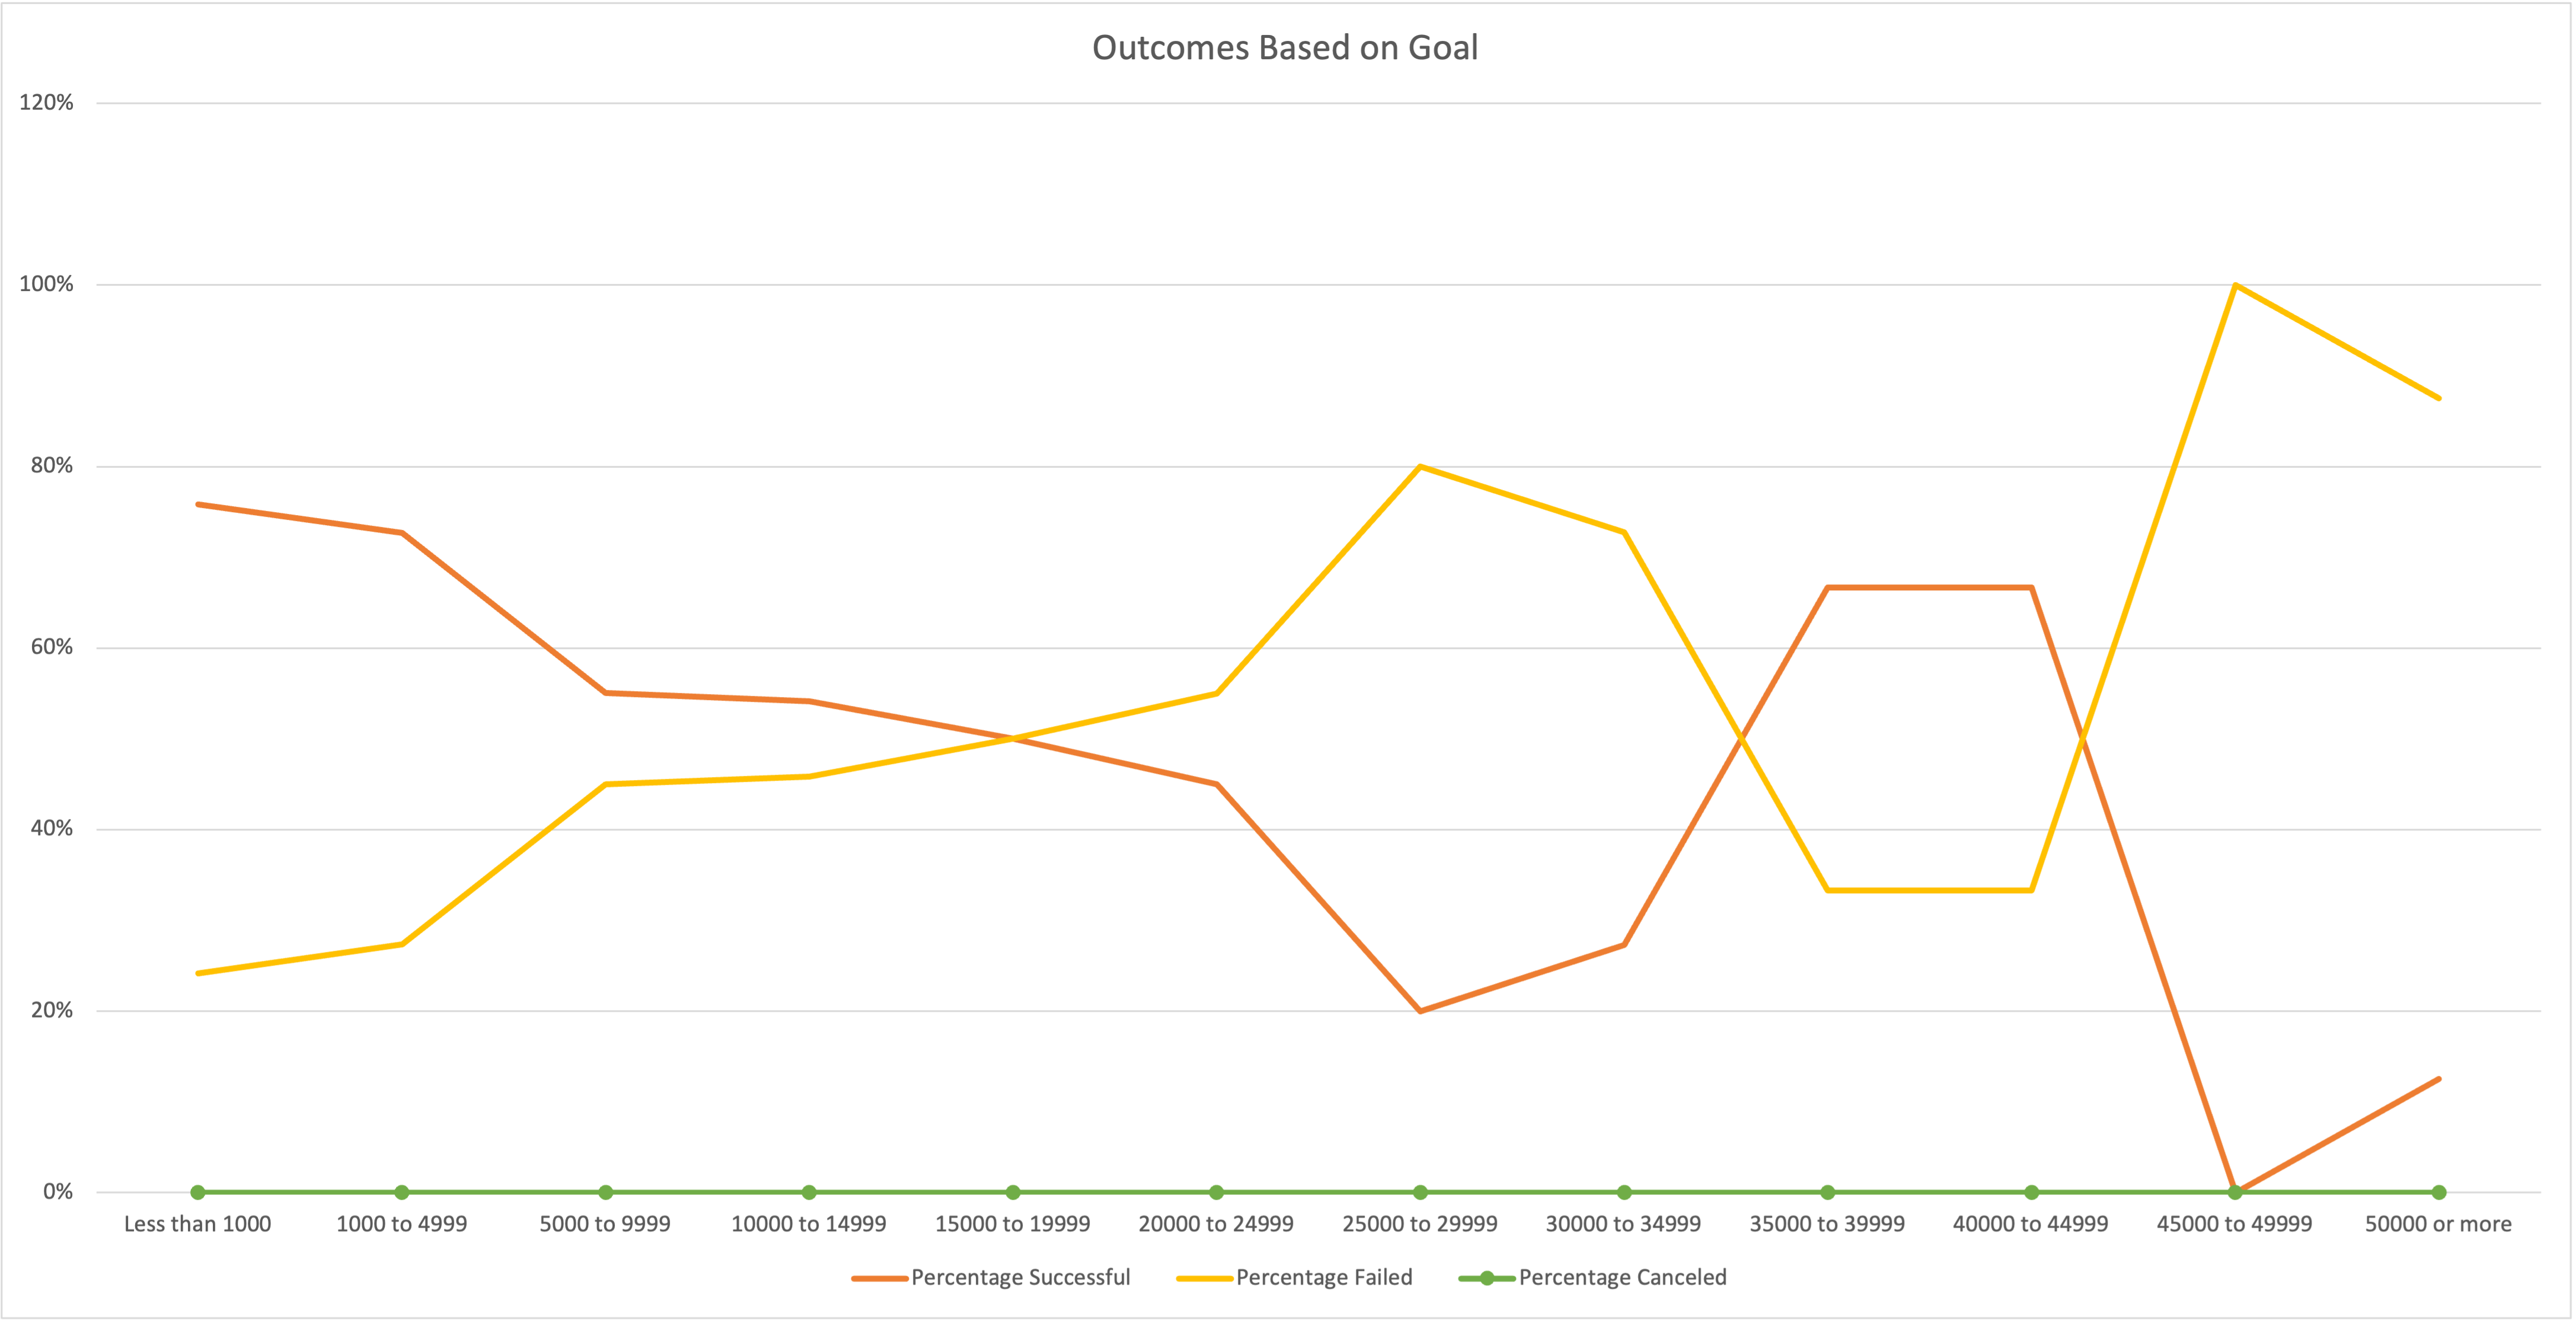
Looking at outcomes based on goals, we do not see any sort of trend in the graph. While there is an increase in successful outcomes at lower goal amounts, we also see that number increase at several larger goal amounts.
The dates in the original data set was not in readable format. We were able to overcome this by utilizing a formula to convert the timestamp into a normal date format. Furthermore, we extracted the months and years from the launch date for further analysis.
When examining outcomes based on launch date, we see that the highest number of successful campaigns We can determine that there is a correlation between launch date and outcomes. Further analysis would need to be done to determine the significance of this correlation. Based on the current research done, we see that the number of successful campaigns is higher between May and July. May specifically had the highest number of successful outcomes. We can determine that campaigns launched during these months would have the highest probability for successful outcomes. When examining outcomes based on goals, can determine that there is no correlation between goal amounts and the probability for a successful campaign. A limitation of this data set would be the timeframe. The dates range from 2010 - 2017, in order to perform analysis now, we would want to expand the data through the year 2021. Another graph to consider would be the outcomes based on the length of the campaign. It's possible that we see a higher success rate in campaigns that ran for longer.