LayoutCreation
Layout creation was something that was needed to fit the needs of the ground station, due to it's demand to change data and visuals over many different experiments and projects. The first iteration of this process was implemented over the duration of Google Summer of Code 2018.
The Initial Window is the first thing that is prompted to the user when USOC starts. It looks like this:
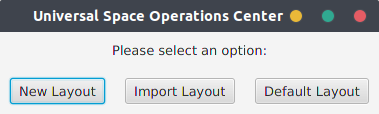
Three steps can be taken from here:
-
Creation of a new layout
- Permits the creation of a new layout from scratch. The LayoutCreator window is shown.
-
Load a layout from disk
- Loads a layout from disk. (As of now, only the json format is supported)
-
Load a default layout
- Loads a file called 'Default.json', found in the
layouts/directory.
- Loads a file called 'Default.json', found in the
More information on how the application handles Layouts can be seen here.
The LayoutCreator is the visual interface that let's the user set up his own settings and data. It looks like this:
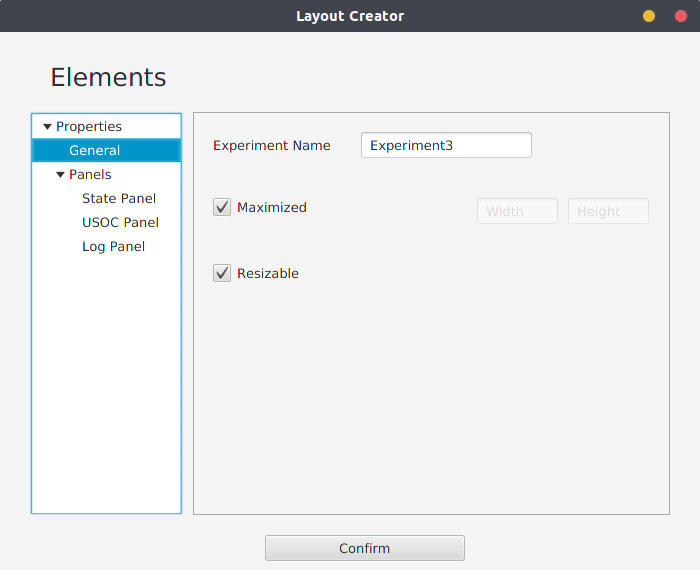
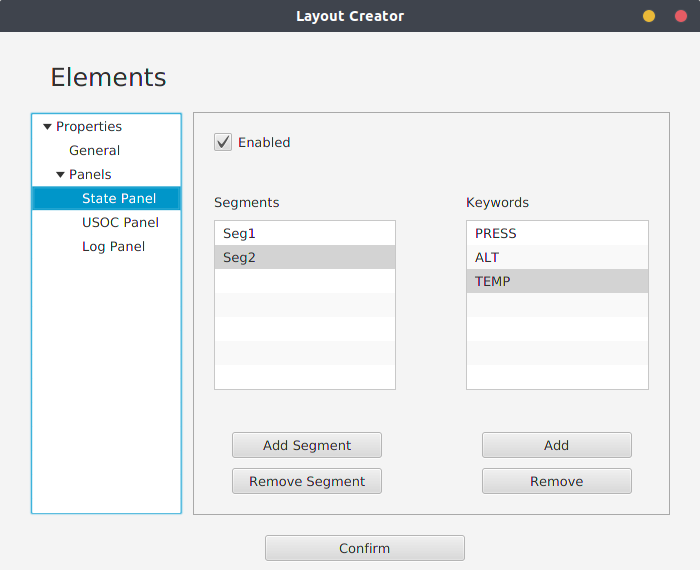
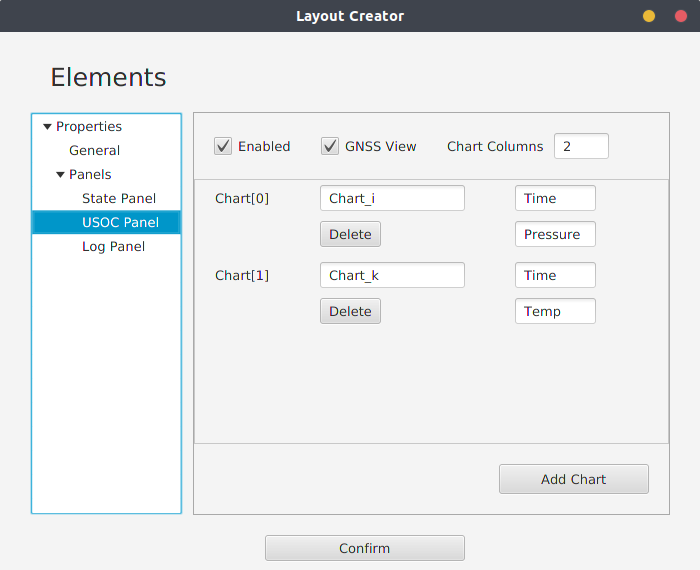
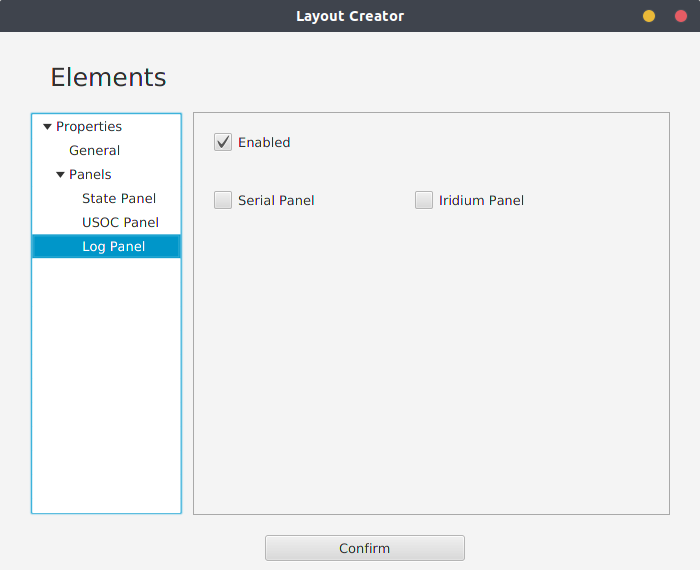
Here, the user can select which settings are best for the experiment's needs. Each panel also has it's own settings and tweaks.
After this process, the user is prompted to either assign data to the UI elements seen above (charts and states) or not.
After selecting all the desired settings, a popup is shown asking the user if he wants to assign data to charts/states now or later. In this process, the Assign Data Window is shown.
It looks like this:
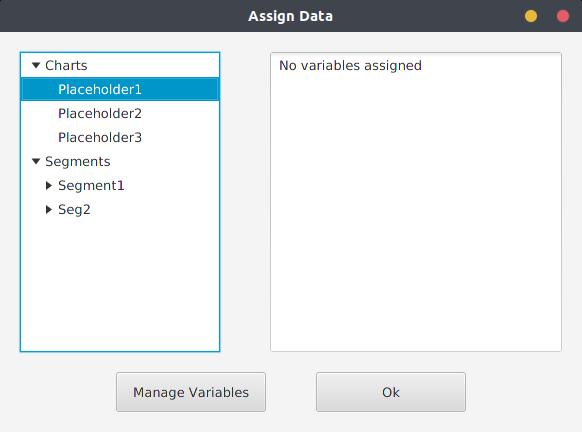
On the left, there's a tree of the previous charts and segments selected. If a user clicks on a UI element, on the right text area will appear what variables are assigned to it. In order to manage that, the user has to click a chart/state and selected 'Manage Variables'. This will show the Variable Management Window:
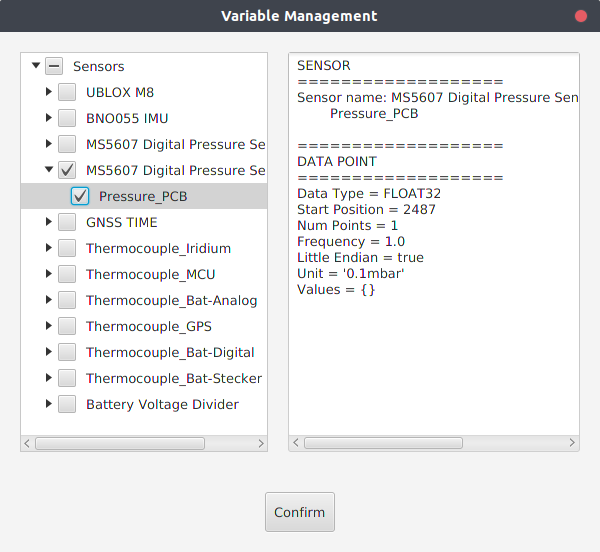
This window is similar to the previous one, except that the left tree shows all sensors and data points from the selected protocol.