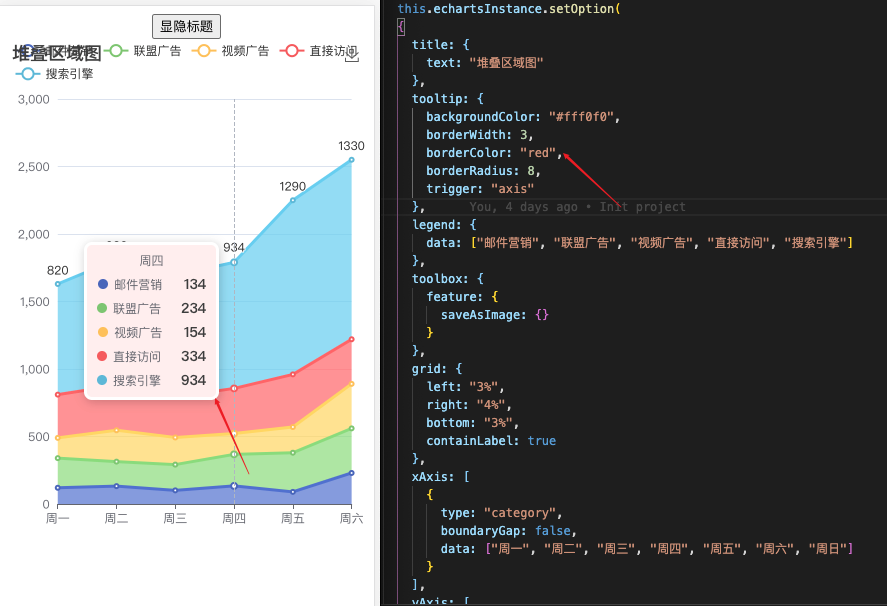
Setting tooltip.borderColor is invalid #13770
Description
Version
5.0.0
Steps to reproduce
step 1: create project ( vue create vue-echarte-demo)
step 2: npm install echarts --save
import * as echarts from "echarts";
Vue.prototype.$echarts = echarts;
step 3: configuration ecahrts options
step 4: npm run dev
versions:
"echarts": "^5.0.0",
"vue": "^2.5.2"
option:  {
        title: {
          text: "堆叠区域图"
        },
        tooltip: {
          backgroundColor: "#fff0f0",
          borderWidth: 3,
          borderColor: "red",
          borderRadius: 8,
          trigger: "axis"
        },
        legend: {
          data: ["邮件营销", "联盟广告", "视频广告", "直接访问", "搜索引擎"]
        },
        toolbox: {
          feature: {
            saveAsImage: {}
          }
        },
        grid: {
          left: "3%",
          right: "4%",
          bottom: "3%",
          containLabel: true
        },
        xAxis: [
          {
            type: "category",
            boundaryGap: false,
            data: ["周一", "周二", "周三", "周四", "周五", "周六", "周日"]
          }
        ],
        yAxis: [
          {
            type: "value"
          }
        ],
        series: [
          {
            name: "邮件营销",
            type: "line",
            stack: "总量",
            areaStyle: {},
            data: [120, 132, 101, 134, 90, 230, 210]
          },
          {
            name: "联盟广告",
            type: "line",
            stack: "总量",
            areaStyle: {},
            data: [220, 182, 191, 234, 290, 330, 310]
          },
          {
            name: "视频广告",
            type: "line",
            stack: "总量",
            areaStyle: {},
            data: [150, 232, 201, 154, 190, 330, 410]
          },
          {
            name: "直接访问",
            type: "line",
            stack: "总量",
            areaStyle: {},
            data: [320, 332, 301, 334, 390, 330, 320]
          },
          {
            name: "搜索引擎",
            type: "line",
            stack: "总量",
            label: {
              normal: {
                show: true,
                position: "top"
              }
            },
            areaStyle: {},
            data: [820, 932, 901, 934, 1290, 1330, 1320]
          }
        ]
      }
What is expected?
borderColor red
What is actually happening?
Setting borderColor has no effect
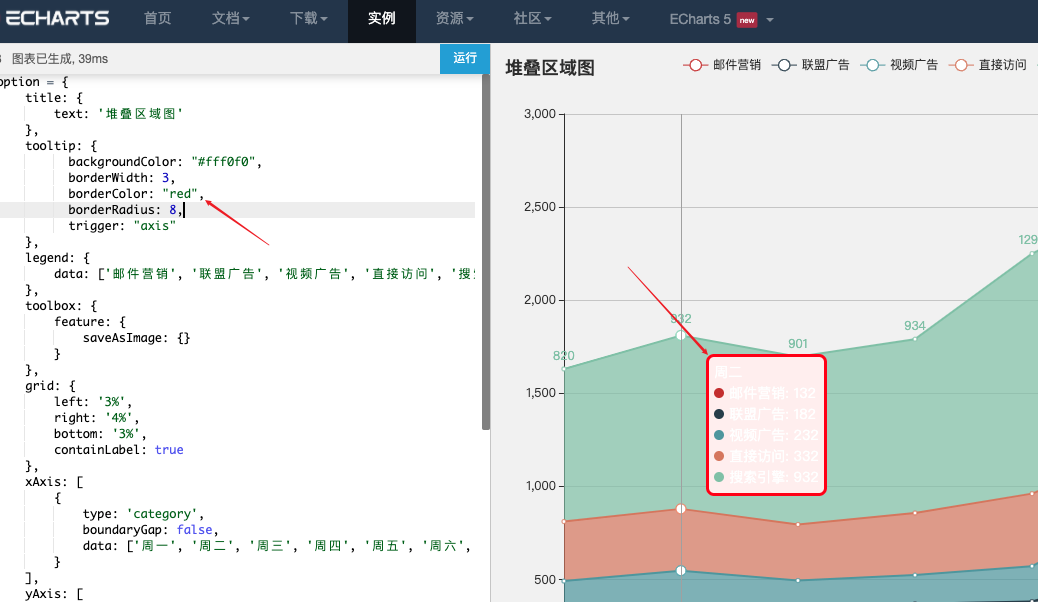
https://echarts.apache.org/examples/zh/editor.html?c=area-stack
The option is copied on this page, and it runs normally on the page,