
This project aims to analyze and predict the air quality index of various cities and states in India using machine learning. The dataset used in this project contains historical data of air quality index readings from various monitoring stations across India.
in my city indore there are several places that show aqi and chemical levels troughout the day in a tabular format, i researched about this topic and found out this research paper https://www.diva-portal.org/smash/get/diva2:1681590/FULLTEXT02 in this research paper they have just taken a small amount of data and shoved it into models
- in this project i have tried my best to make and better model with more data 100000, compared to 30000 in the research paper
- and extract usefull and meaningfull insights about aqi trend in india using interactive and good looking maps
The project is divided into 3 Parts:
-
Preliminary and heavy Exploratory analysis of historical aqi data from indian states and citites has been done in this
-
main visual insights are as follows:
- trend of aqi throughout the years
- aqi trend of states in india
- aqi trend of cities in india
- yearly/ monthly state_Aqi_from_2015_to_2020 function
- yearly/ monthly city_Aqi_from_2015_to_2020 function
- correlation of toxic gasses with aqi (top 3)
- yearly/monthly state_toxic_gas_from_2015_2020 india function
- yearly/monthly city_toxic_gas_from_2015_2020 india function
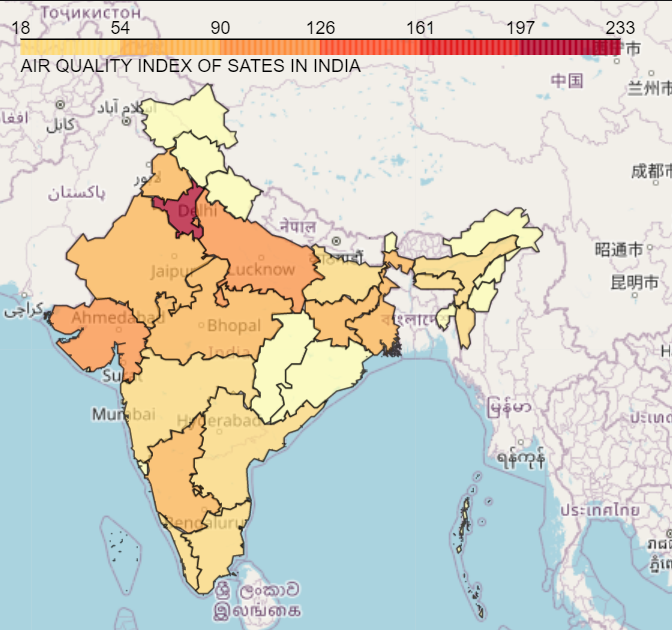
- aqi of states on an india map
- aqi of cities on an india map
an example of these visualization, 10. aqi of cities on an india map
refer to 1_exploratory_analysis_of_aqi_in_india.ipynb or README_PART1 to get insights on more visualizations
this uses the station_merged_csv and does performs these tasks:
-
Exploratory analysis of Columns has been performed and heavy data preprocessing has been done
-
then this preprocessed data is used to train 3 models: multiple linear reggresion, SVR, XGBRegressor
-
the best model made was xgb_model (Training score: 0.95, Testing score: 0.91, MEA : 21.22 , MSE: 1370.24, RMSE: 37)
this is the main gui program that uses the xgb_model to predict aqi of a region based on 12 factors and show the output to the user
-
for more insights and detailed process regaurding exploratory and preliminary analysis with visual and interacvtible graphs refer README_PART1 (part 1 of this project)
-
For more insights on data distribution, data preprocessing and inputs/ outputs of 3_main_AQI_predictor refer to README_PART_2_3
-
🛃 in order README --> README_PART1 --> README_PART_2_3
- the dataset station_merged csv is a combination of station_day csv and station csv
| # | Column | Non-Null Count | Dtype | meaning |
|---|---|---|---|---|
| 0 | StationId | 108035 non-null | object | id of the station |
| 1 | City | 108035 non-null | object | city in which the station is located |
| 2 | State | 108035 non-null | object | state in which the station is located |
| _ | Date | 108035 non-null | object | date of the readings (now removed) |
| 3 | PM2.5 | 86410 non-null | float64 | amount of said checmical in the air |
| 4 | PM10 | 65329 non-null | float64 | amount of said checmical in the air |
| 5 | NO | 90929 non-null | float64 | amount of said checmical in the air |
| 6 | NO2 | 91488 non-null | float64 | amount of said checmical in the air |
| 7 | NOx | 92535 non-null | float64 | amount of said checmical in the air |
| 8 | NH3 | 59930 non-null | float64 | amount of said checmical in the air |
| 9 | CO | 95037 non-null | float64 | amount of said checmical in the air |
| 10 | SO2 | 82831 non-null | float64 | amount of said checmical in the air |
| 11 | O3 | 82467 non-null | float64 | amount of said checmical in the air |
| 12 | Benzene | 76580 non-null | float64 | amount of said checmical in the air |
| 13 | Toluene | 69333 non-null | float64 | amount of said checmical in the air |
| 14 | Xylene | 22898 non-null | float64 | amount of said checmical in the air |
| 15 | AQI | 87025 non-null | float64 | the air quality that day |
| 16 | AQI_Bucket | 87025 non-null | object | AQI catagory ranges from good to severe |
| 17 | year | 87025 non-null | float64 | year of the reading |
| 18 | month | 87025 non-null | float64 | month of the reading |
| 18 | date | 87025 non-null | float64 | day of the reading |
The dataset is avaible on kaggle this is the link: https://www.kaggle.com/datasets/rohanrao/air-quality-data-in-india
- city_day csv
- city_hour csv
- station_day csv
- station_hour csv
- station csv
The links for geo json files of india are as follows:
- state geojson: https://github.com/Subhash9325/GeoJson-Data-of-Indian-States
- district geojson: https://www.kaggle.com/datasets/krutarthhd/india-geojson-file?select=district
many insights have been made in part 1 of this project some of which are as follows:
-
the AQI of india has steadily decreaseed over the years the present having the freshest air
-
Gujrat has the worst aqi followed by delhi when it comes to indian states, mizoram has the best aqi
-
ahemdabad has the worst aqi followed by delhi when it comes to indian citites aizawl has the best aqi
-
PM2.5, PM10, NO2 are the biggest contributers of air polution and aqi
-
many many more have been done refer to README_PART1.md for more insights
after analysing the data and training the model these insights have been extracted
-
The best model in the research paper was (Ridge regression mea = 27.907, rmse = 36.791, r2 = 0.8089) on city_data csv
-
my best model in this notebook was (xgb_model mea = 21.22, rmse = 37.011, r2 = 0.91) on station_data csv
-
the city_data csv has only 30000 rows while station_data csv has 100000 which is way more data
-
my model has achived better mea and r2 scores on a bigger scale of data making it better than the ridge reggression model made in the research paper
-
but my is not the best and can still be upgraded
-
xgb_model has worse rmse of 37.011 which is 1 units more than rigde regression model
- the project is available onlyon pc with python installed
- making the model avaible on mobile apps
- a dedicated website for the model
- a better model which increases the rmse score
- made by Aryan Rathore
- LinkedIn : https://www.linkedin.com/in/aryan-rathore-b15459215/
- email: aryanrathore13572002@gmail.com, aryan.rathore2021@vitbhopal.ac.in