WCSAxes changes font size and axis spine styles #7485
Description
WCSAxes seems to modify or set some matplotlib style settings
Compare:
with mpl.rc_context(rc=mpl.rcParamsDefault):
    fig, ax = plt.subplots(1, 1, figsize=(4, 4))
vs.
with mpl.rc_context(rc=mpl.rcParamsDefault):
    fig, ax = plt.subplots(1, 1, figsize=(4, 4),
                           subplot_kw=dict(projection=wcs))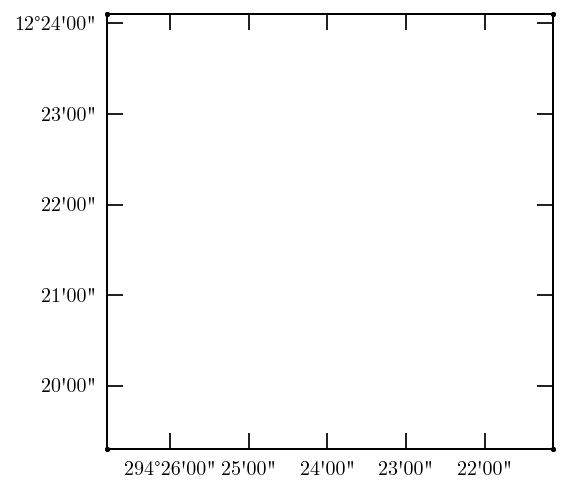
- Does it need to change the tick font size?
- Any idea why markers are appearing at the intersections of the axis spines?
- It also seems to add ticks to the upper and right axes.
cc @astrofrog