Home
This wiki was originally written by @andyblac and is maintained here with his permission. Contributions are welcome — anyone with a GitHub account can edit these pages directly.
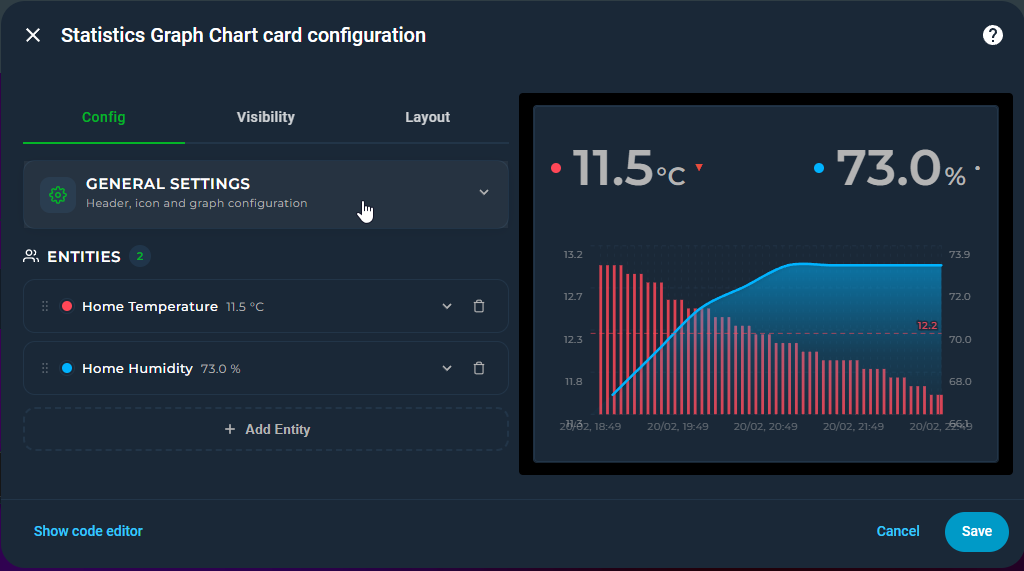
A feature-rich custom card for Home Assistant that combines a time-series graph with live state rows in a single card. It has no external dependencies and can be configured through either the visual editor or YAML.
Note
Source availability — this card is distributed as a minified/protected bundle. The readable source code is not published, so the repository is not set up for external code review or pull requests. Bug reports and feature requests are very welcome in Issues — that is how every feature in this card has been shaped so far. Please factor this in when deciding whether to install.
- Time, History and Comparison
- Data Sources and Math
- Layout and Appearance
- Zoom, Export and Tools
- Multi-Card Sync
- Templates
If the card is useful to you, consider starring the repository or supporting development.