Multi Card Sync
🔗 Tooltip Sync
Synchronize hover crosshairs across multiple cards on the same dashboard page. When you hover over one card, all synced cards show their tooltip and crosshair at the same timestamp — even if they display different entities or different time ranges.
This is a card-level feature (not entity-level), because what's shared is a timestamp, not an entity value. All entities on a synced card show their values at that moment simultaneously.
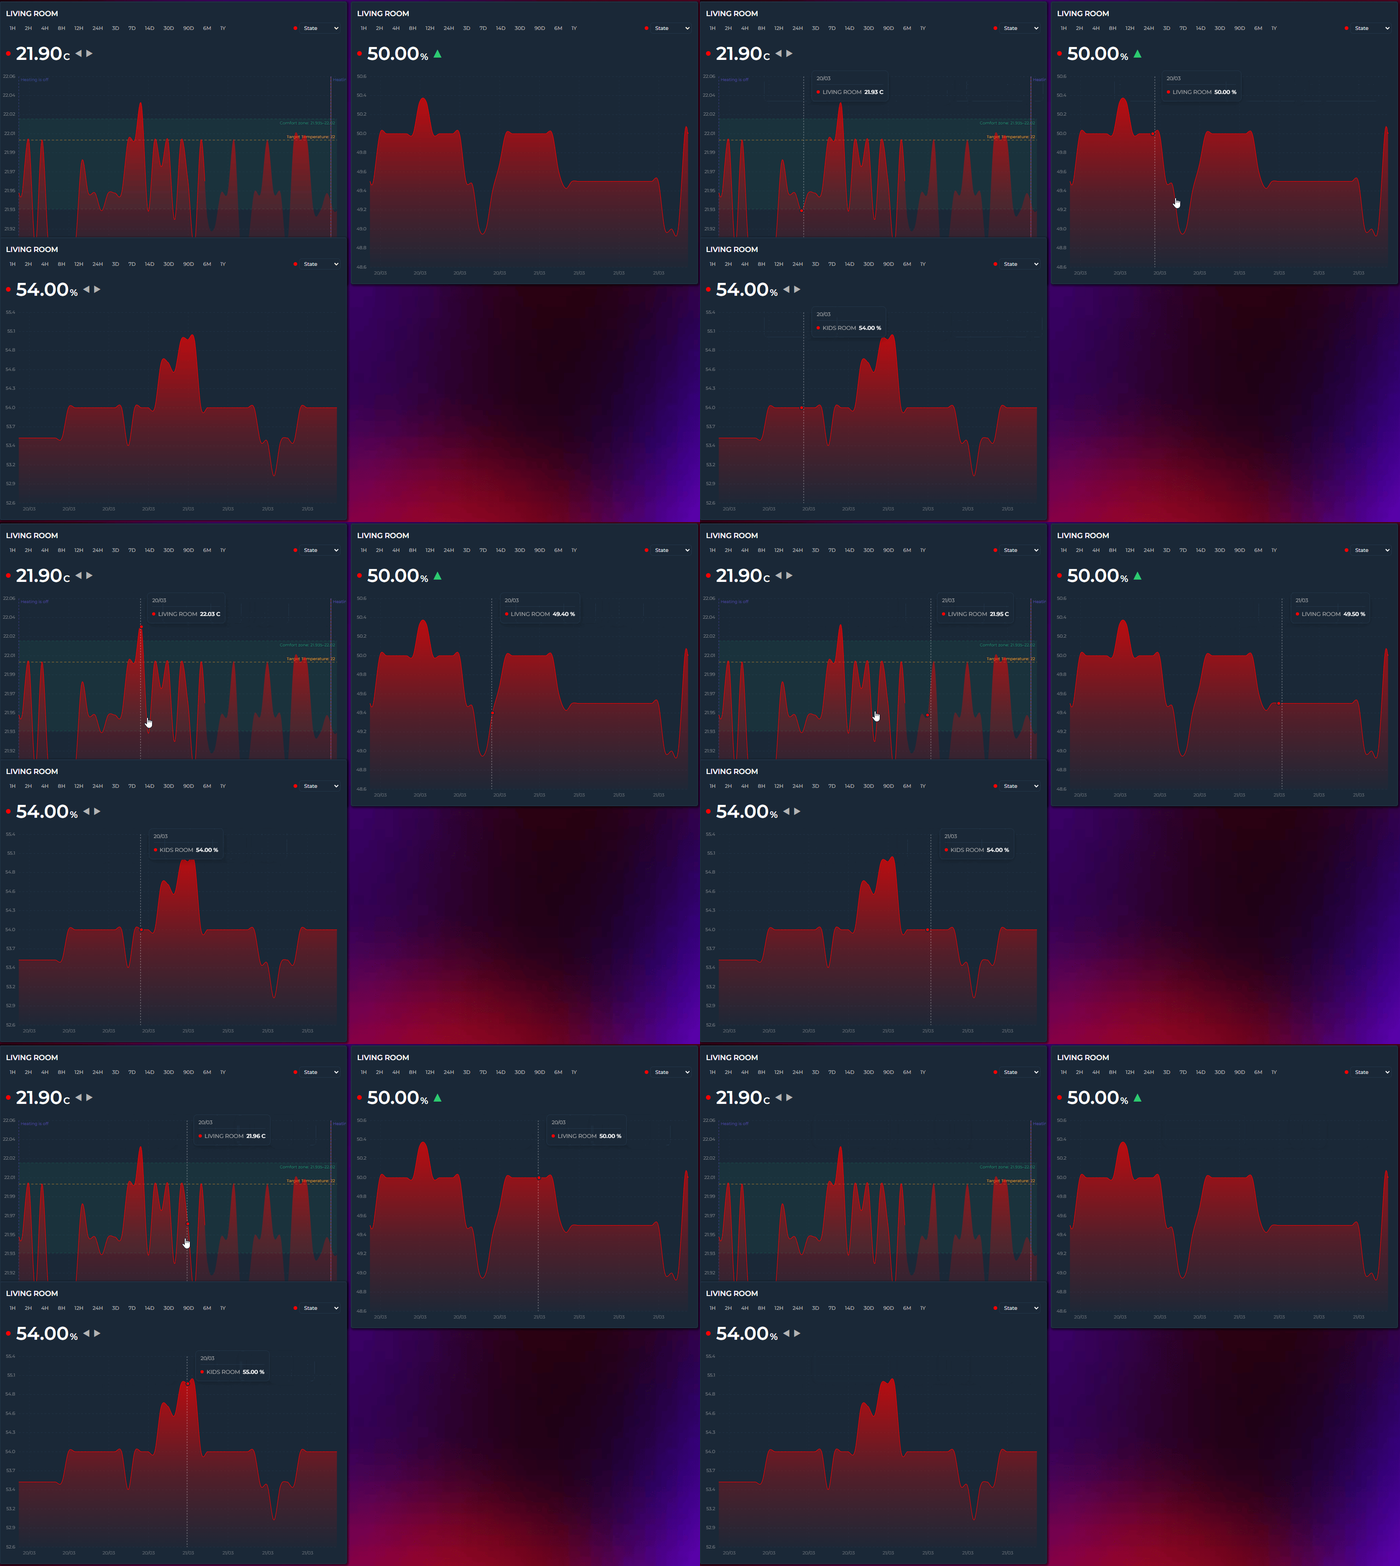
Enable Tooltip Sync on each card you want to participate, and give related cards the same Sync Group name:
# Card 1 — Bedroom Temperature
type: custom:statistics-graph-chart-card
tooltip_sync: true
tooltip_sync_group: "bedroom"
entities:
  - entity: sensor.bedroom_temperature

# Card 2 — Bedroom Humidity (syncs with Card 1)
type: custom:statistics-graph-chart-card
tooltip_sync: true
tooltip_sync_group: "bedroom"
entities:
  - entity: sensor.bedroom_humidity

# Card 3 — Kitchen Temperature (independent)
type: custom:statistics-graph-chart-card
tooltip_sync: true
tooltip_sync_group: "kitchen"
entities:
  - entity: sensor.kitchen_temperature

# Card 4 — Energy (no sync at all)
type: custom:statistics-graph-chart-card
entities:
  - entity: sensor.energy
In this setup:
- Cards 1 and 2 sync with each other (both in "bedroom" group)
- Card 3 syncs only with other "kitchen" cards
- Card 4 has no sync — hovering over it broadcasts nothing, and it ignores broadcasts from others
| Sync Group value | Behavior |
|---|---|
"bedroom" |
Syncs only with other cards that have tooltip_sync_group: "bedroom"
|
"kitchen" |
Syncs only with "kitchen" cards |
| (empty / not set) | Syncs with all tooltip-synced cards on the page, regardless of their group |
tooltip_sync: false |
Card does not participate in sync at all |
Tip: The group name is completely arbitrary — use room names, floor numbers, or any string you like. It just needs to match across the cards you want to link.
- You hover over Card A — the card shares the hovered moment (the timestamp) with the rest of the page
- Every other card with Tooltip Sync enabled listens for it
- If the group matches exactly, the receiving card moves its own crosshair and tooltip to that same moment. An empty group is a group in its own right: ungrouped cards sync only with other ungrouped cards, and never with a named group
- When you move the mouse away, all synced tooltips clear together
Cards with different hours_to_show ranges still sync correctly — the shared language is the timestamp, not the pixel position. A card showing 24H and a card showing 7D will both jump to 2:35 PM if that's where your mouse is.
Timeline mode only.
🔍 Zoom Sync
Synchronize zoom windows across multiple cards. When you brush-zoom into a time range on one card — or double-click to reset — every other card in the same group adopts the same window. The exact same tooltip_sync_group pattern, just for zoom instead of hover.
Enable Zoom Sync on each card you want to participate, and give related cards the same Sync Group name:
# Card 1 — Energy Production
type: custom:statistics-graph-chart-card
zoom_sync: true
zoom_sync_group: "energy"
entities:
  - entity: sensor.energy_produced

# Card 2 — Energy Consumption (zoom mirrors Card 1)
type: custom:statistics-graph-chart-card
zoom_sync: true
zoom_sync_group: "energy"
entities:
  - entity: sensor.energy_consumed

# Card 3 — Climate (independent zoom)
type: custom:statistics-graph-chart-card
zoom_sync: true
zoom_sync_group: "climate"
entities:
  - entity: sensor.living_room_temperature
In this setup, brush-zooming Card 1 zooms Card 2 to the same window — Card 3 keeps its own zoom.
- You brush-zoom on Card A — once the zoom completes, the start and end of the new window are shared with the rest of the page
- Every other card with Zoom Sync enabled listens for it
- If the group matches exactly, the receiving card adopts the same time window. An empty group is a group in its own right: ungrouped cards sync only with other ungrouped cards, and never with a named group
- Resetting the zoom on any synced card clears the zoom on every card in the group
The time window is shared in real time (timestamps, not pixels) so cards with different hours_to_show or points_per_hour still land on exactly the same zoomed range.
Pinch zoom (new in v3.25) participates too — the pinched window is broadcast once at gesture end, not continuously while the fingers move. And since double-click / double-tap now steps back one zoom level at a time (see Brush Zoom → Zoom History), each step is broadcast as well, so every card in the group walks back through the levels together.
Drill Down (new in v3.33) rides the same channel: every drill step and every step back out broadcasts its window, so the group stays on the same period. The receiving cards narrow to that window from the data they already hold — the finer refetch happens on the card you clicked, so set drill_down: true on each card you want to fetch detail rather than just follow along.
A date picker or interval picker change arriving from another card — through date_picker_group or interval_picker_group — also clears any drill levels on the receiving card, so a synced period change never leaves a partner card stuck inside an old drilled slice.
All three sync features use independent groups so you can mix them however you like — for a fully-linked dashboard, give all three the same group name on every card:
tooltip_sync: true
tooltip_sync_group: "main"
zoom_sync: true
zoom_sync_group: "main"
scroll_sync: true
scroll_sync_group: "main"
Timeline mode only. Requires Brush Zooming to be enabled.
↔️ Scroll Sync
Synchronize horizontal scrolling across cards. Most useful with max_visible_interval set so the chart is wider than what's visible — scrolling one card slides every other card in the same group to the matching position.
# Card 1 — 40 days total, 10 days visible at a time
type: custom:statistics-graph-chart-card
hours_to_show: 960              # 40 days
max_visible_interval: 240       # 10 days visible
scroll_mode: scrollbar
scroll_sync: true
scroll_sync_group: "energy"
entities:
  - entity: sensor.energy_produced

# Card 2 — same setup, scrolls in lock-step
type: custom:statistics-graph-chart-card
hours_to_show: 960
max_visible_interval: 240
scroll_mode: scrollbar
scroll_sync: true
scroll_sync_group: "energy"
entities:
  - entity: sensor.energy_consumed
Now dragging the scrollbar (or wheel-scrolling, depending on scroll_mode) on one card moves the other to the matching position.
The shared value is a relative scroll position (0–1), not absolute pixels. That means:
- Cards with identical width and
hours_to_showstay perfectly aligned - Cards with different sizes still land on the same relative point — if you're halfway through Card A's scroll range, Card B jumps to halfway through its own range
- Cards without a scrollable area (
max_visible_intervalnot set, or the data isn't wide enough) silently ignore broadcasts
Cards never enter a feedback loop — a card that moves in response to a sync event does not broadcast that movement back.
Identical group rules to Tooltip / Zoom Sync. Use the same group name across all three for a fully linked experience — hover, zoom and scroll all stay in step.
Timeline mode only.