mgr/dashboard: Landing Page improvements#36476
Conversation
c13fb74 to
0737edc
Compare
0737edc to
341a01d
Compare
|
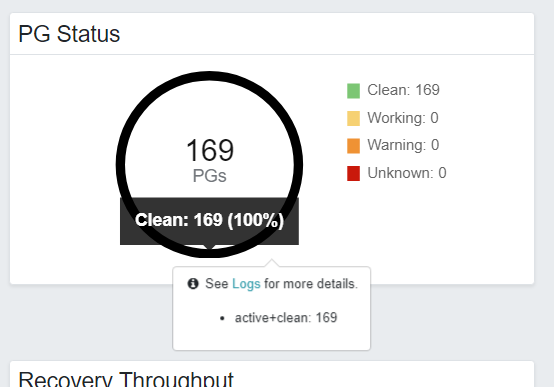
Is it possible to add a debounce or timeout for the chart hover? |
src/pybind/mgr/dashboard/frontend/src/app/ceph/dashboard/health-pie/health-pie-color.enum.ts
Outdated
Show resolved
Hide resolved
43d629b to
429e617
Compare
src/pybind/mgr/dashboard/frontend/src/app/ceph/dashboard/info-card/info-card.component.scss
Outdated
Show resolved
Hide resolved
@tspmelo Done: now the popover shows only when clicking on the doughnut slice. |
429e617 to
0045f14
Compare
|
jenkins test make check |
|
@alfonsomthd I'm guessing the following error: |
0045f14 to
777f43d
Compare
@tspmelo Done: as per our previous conversation, only the Logs tooltip will be shown in that card as it was a requested feature. |
|
Just noticed that the Objects chart is the only one that doesn't show the value in the labels. |
|
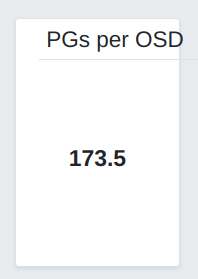
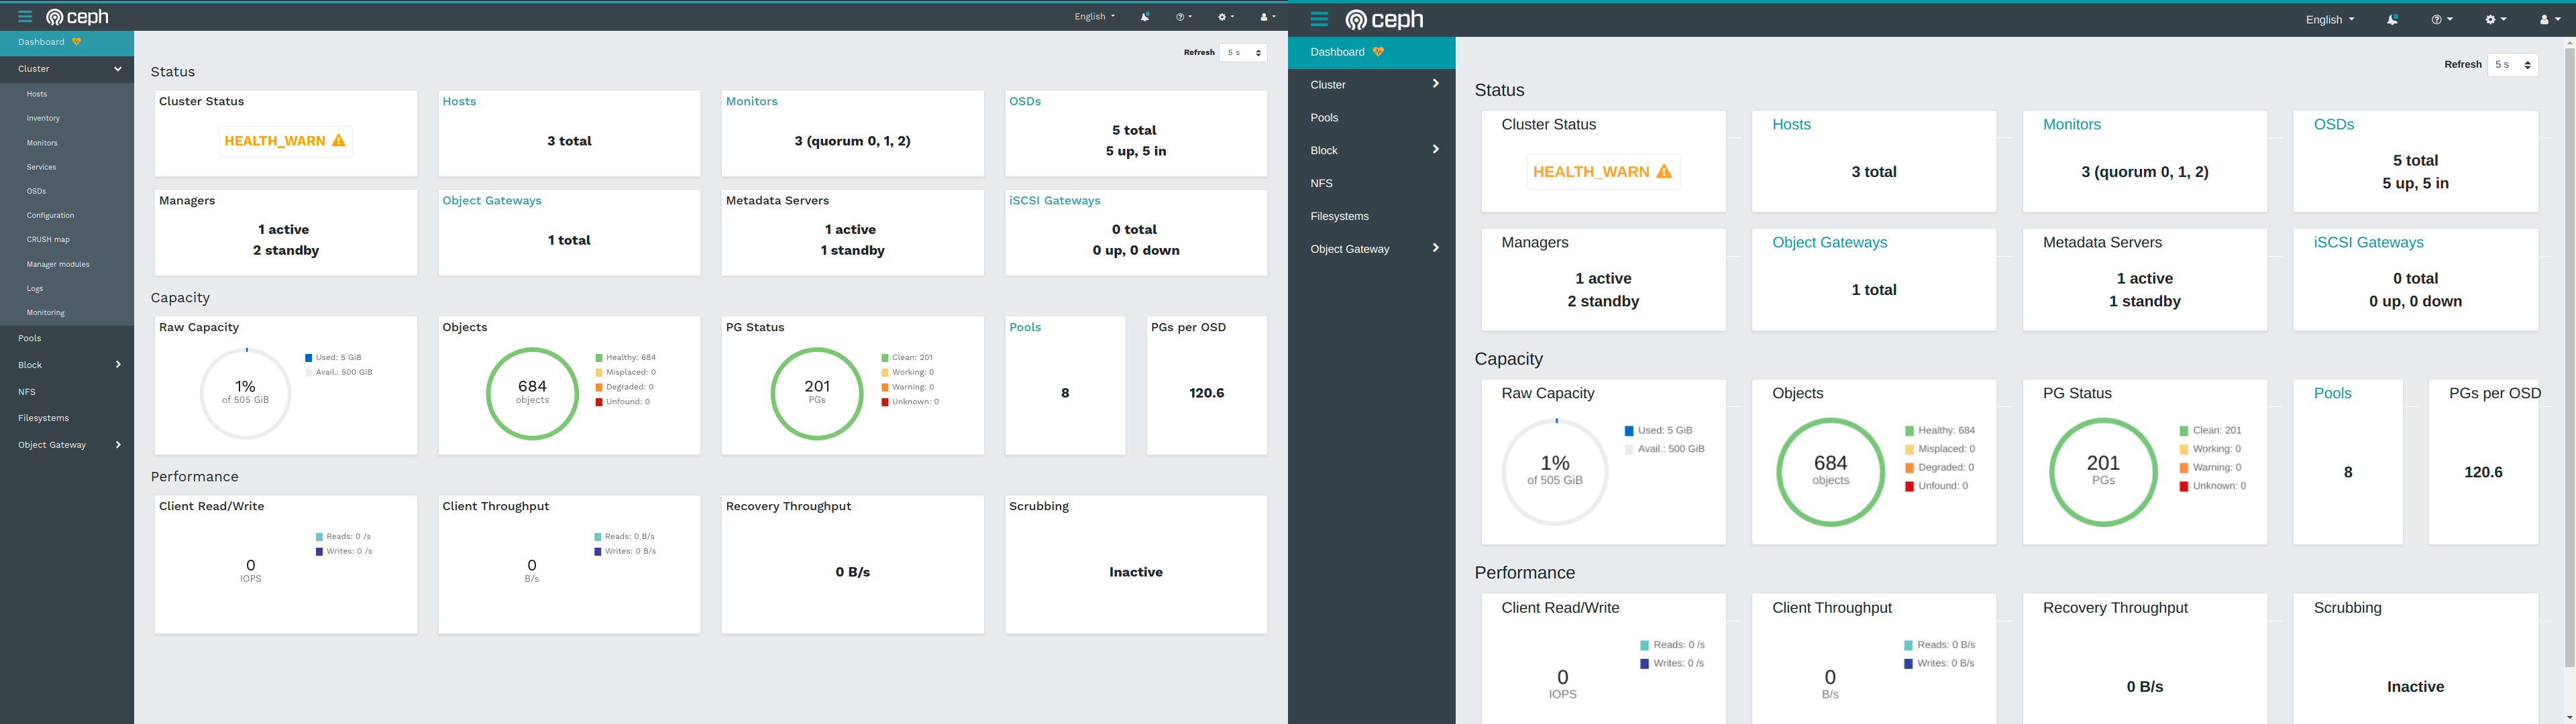
Tested this locally today, nice work @alfonsomthd! This is definitely an improvement. Somehow tooltips were not displayed in my test environment, not sure why. But that explains why the mouse cursor changed from an arrow to a pointing finger when I hovered above the chart widgets. Some minor observations: In Chromium, the "PGs per OSD" label overflows the widget (it's fine in Firefox): I think we discussed this during the standup already, but I would find it cleaner if there is no horizontal line separator between the label and the content. In Chrome, these lines also overflow the content box on the right:
|
src/pybind/mgr/dashboard/frontend/src/app/ceph/dashboard/health-pie/health-pie.component.scss
Outdated
Show resolved
Hide resolved
I didn't touch it: this has been there for a long time, intentional.
@LenzGr Can you check the zoom? And the screen resolution you use?
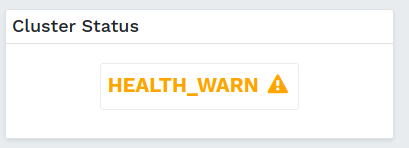
I remember you pointing this out, but wasn't sure about the quorum: I'll remove it! |
777f43d to
b1342df
Compare
@tspmelo Done: added values to objects legend. |
OK, let's leave it as is then. It may make help users to realize that it's actually clickable.
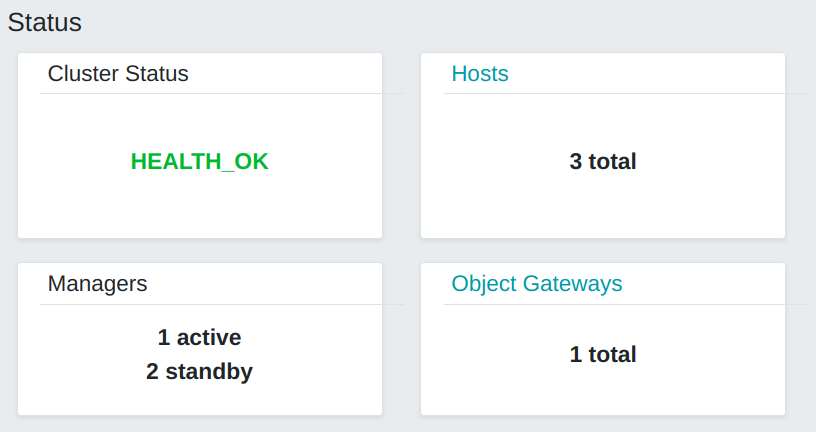
So it was not a zoom issue, both Firefox and Chromium rendered the page at the 100% setting. However, I do have the GNOME accessibility setting "Large Text" enabled, which AFAIK changes the DPI settings and this causes the weird rendering on Chrome (right window):
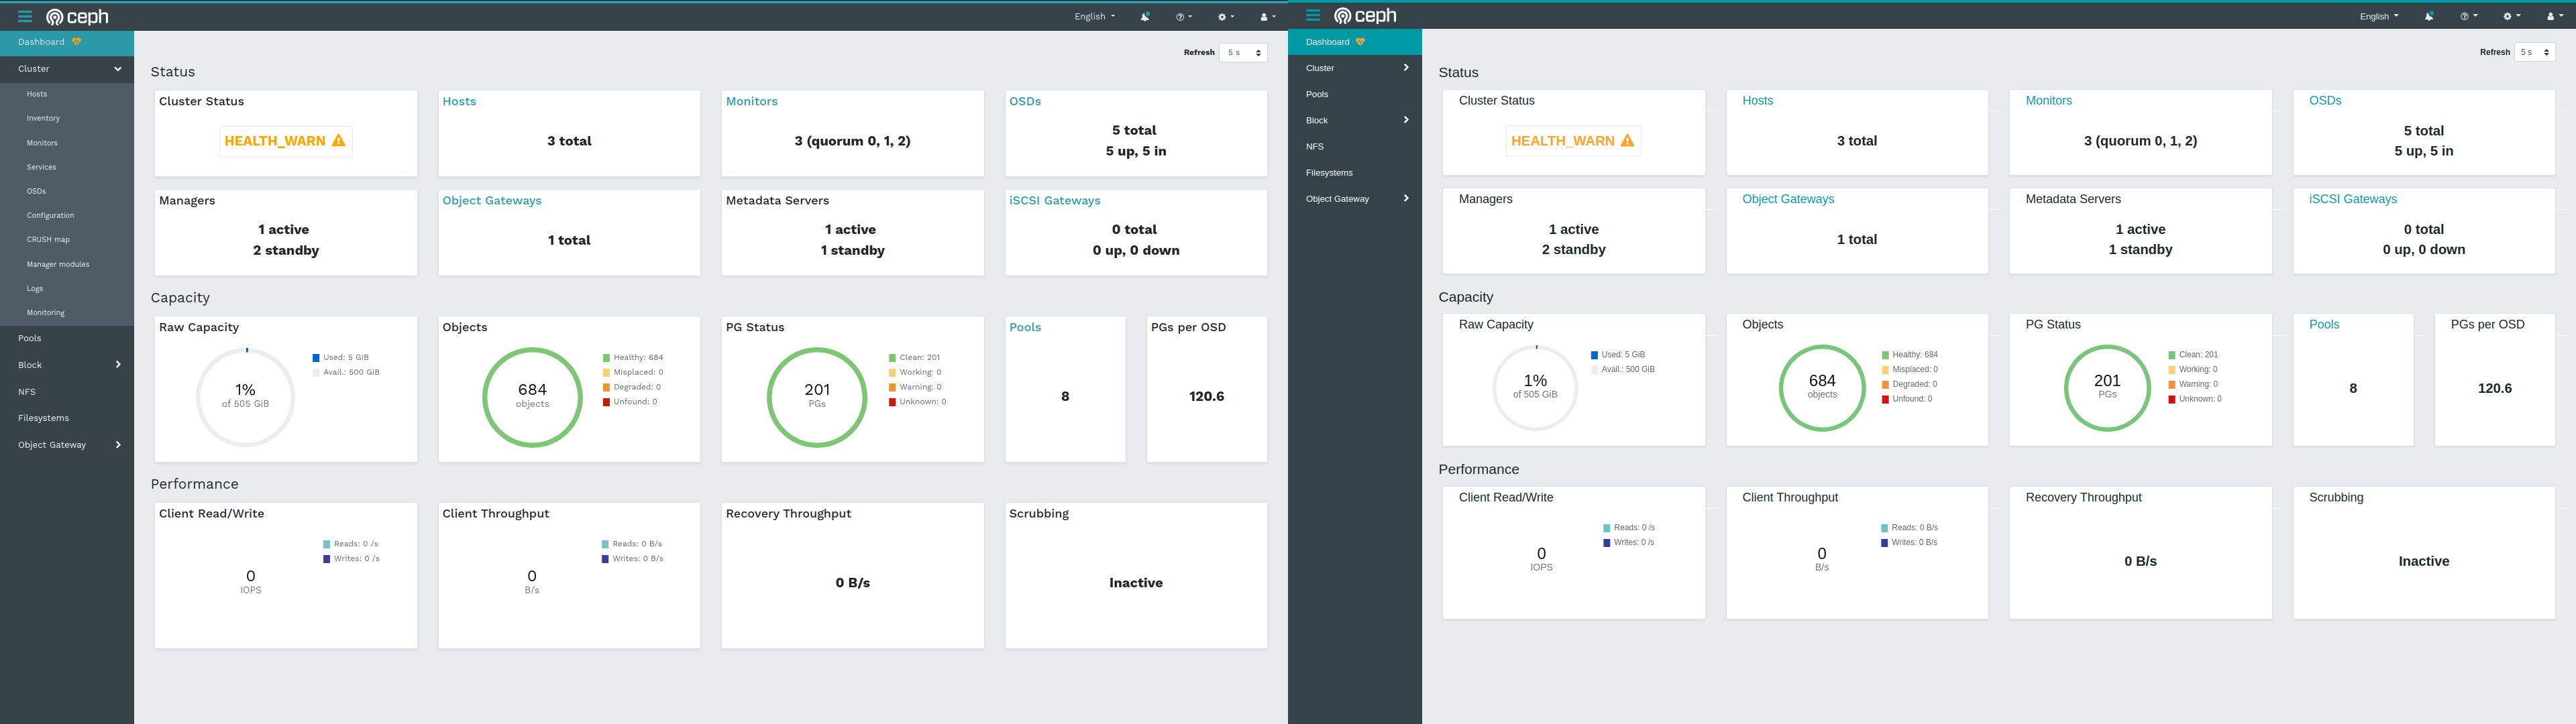
Without "Large Text", it looks fine:
Thanks! I think it looks better without them. |
b1342df to
75fdb00
Compare
 tspmelo
left a comment
tspmelo
left a comment
There was a problem hiding this comment.
these 3 lines doesn't seem to do anything.
src/pybind/mgr/dashboard/frontend/src/app/ceph/dashboard/info-card/info-card.component.scss
Outdated
Show resolved
Hide resolved
src/pybind/mgr/dashboard/frontend/src/app/ceph/dashboard/info-card/info-card.component.scss
Outdated
Show resolved
Hide resolved
src/pybind/mgr/dashboard/frontend/src/app/ceph/dashboard/info-card/info-card.component.scss
Outdated
Show resolved
Hide resolved
75fdb00 to
d0e8323
Compare
Fixes: https://tracker.ceph.com/issues/42072
Signed-off-by: Alfonso Martínez <almartin@redhat.com>
d0e8323 to
d66e684
Compare
|
jenkins test api |
|
jenkins test make check |
|
jenkins test dashboard |
|
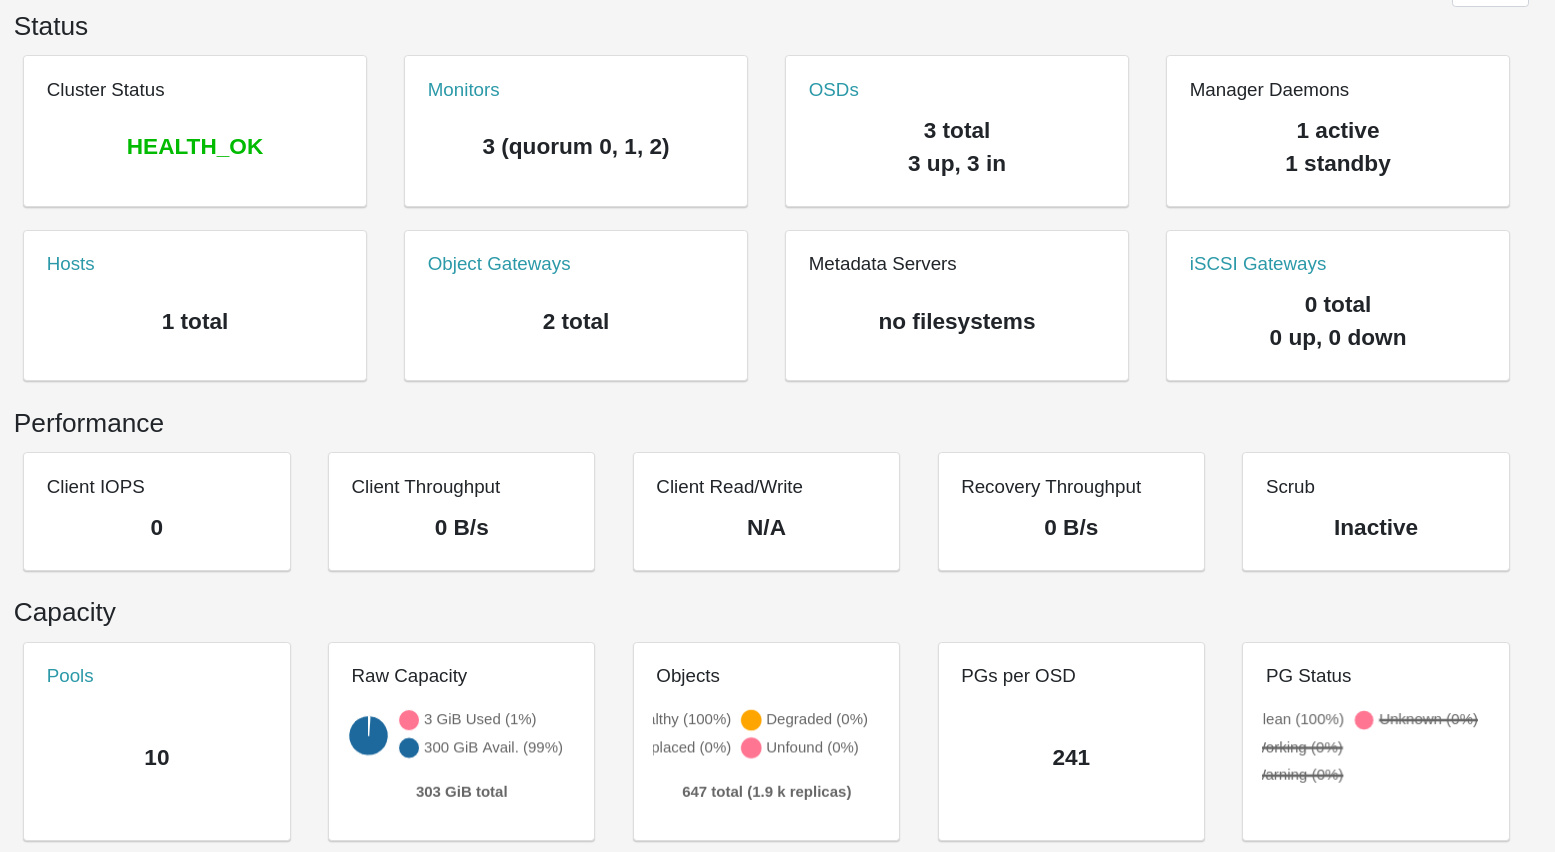
This PR also addresses one suggestion about improving the raw capacity widget from this issue: mgr/dashboard: Enhance info shown in Landing Page cards 'PGs per OSD' & 'Raw Capacity' |
Fixes: https://tracker.ceph.com/issues/42072
Signed-off-by: Alfonso Martínez almartin@redhat.com
NOW:
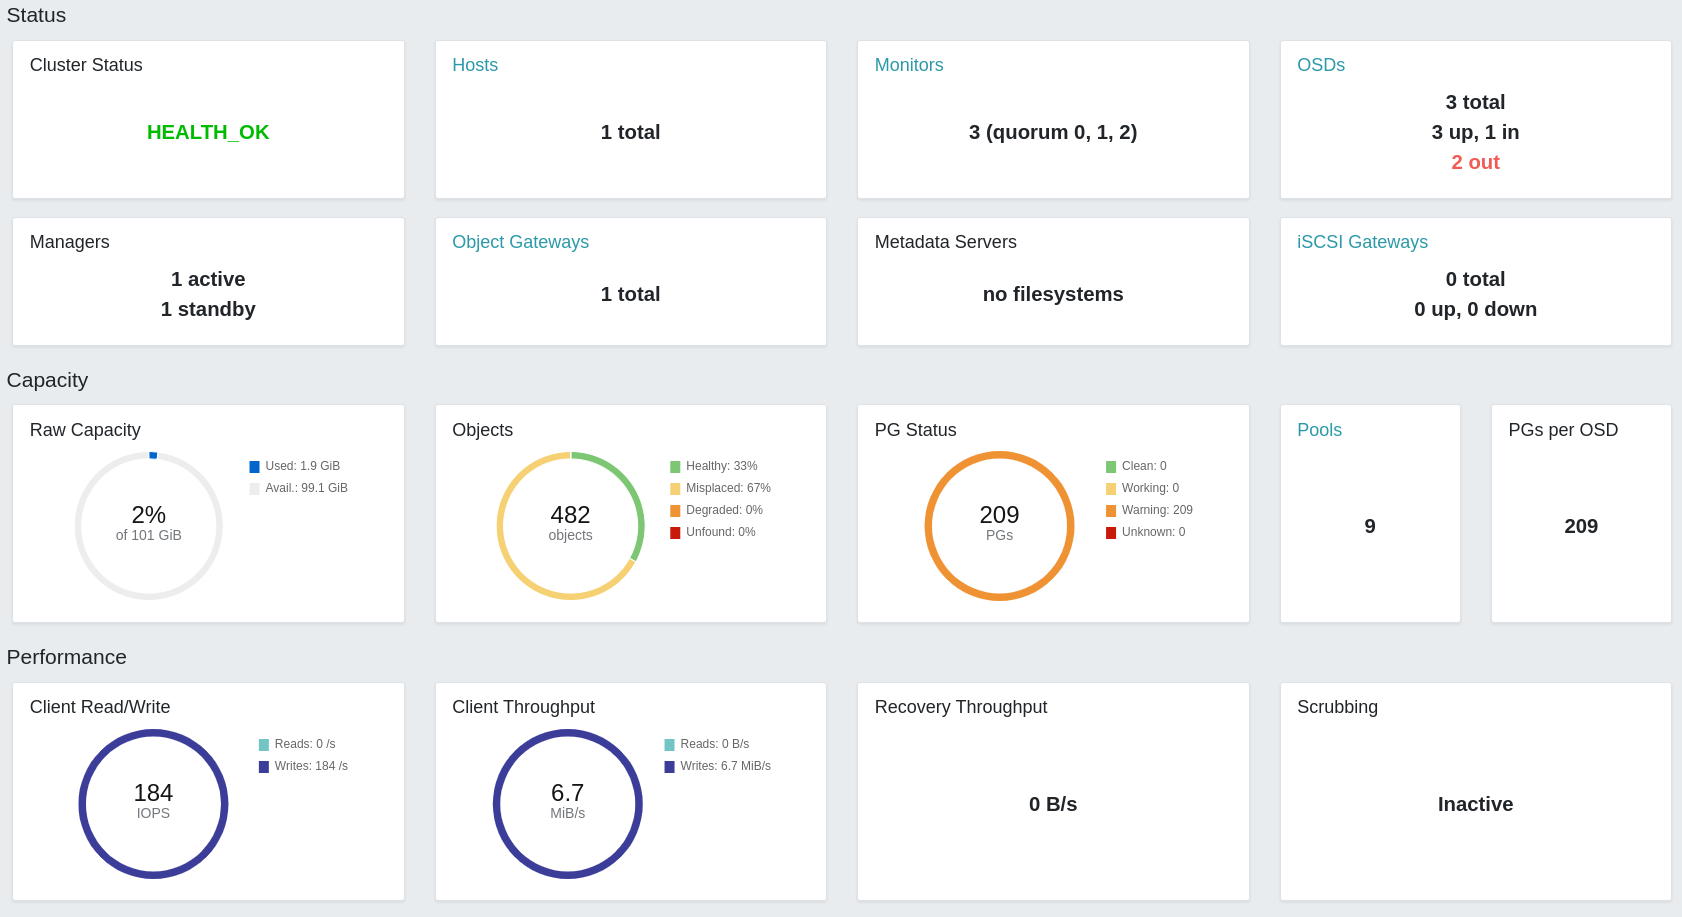
BEFORE:
Checklist
Show available Jenkins commands
jenkins retest this pleasejenkins test classic perfjenkins test crimson perfjenkins test signedjenkins test make checkjenkins test make check arm64jenkins test submodulesjenkins test dashboardjenkins test apijenkins test docsjenkins render docsjenkins test ceph-volume alljenkins test ceph-volume tox