RFC: Historical Hot Ranges #76895
Conversation
|
This change is |
delete .DS_Store
e6c558f to
a8c7346
Compare
There was a problem hiding this comment.
Can you outline in this RFC:
-
how is the data stored? The RFC mentions something about
crdb_internal.historical_hot_ranges, howevercrdb_internalis a virtual schema and cannot store anything, so I am assuming that would merely be some kind of synthetic view. What is the table, and what is the SQL schema for the table? Please also include the index definitions. -
what component in the system will be responsible for scanning and aggregating this data? Is this component going to run in a distributed fashion? If not, which node will run it? If yes, which instance is responsible for which part of the workload?
Reviewable status:
complete! 0 of 0 LGTMs obtained (waiting on @irfansharif and @tbg)
|
@knz thanks for the questions. I'll work on adding these details. Regarding your second bullet point, can you clarify if the section titled Metric Generation addresses your concerns? Do I need to add more detail here? |
There was a problem hiding this comment.
Sweet RFC! This is really exciting and I'm glad we've got the ball rolling. A few questions and notes:
- Given that CRDB is now multi-tenant, how are we expecting HHR to work for secondary tenants? We can talk about this offline if you'd like. When thinking about storing range-level data in system tables, that sounds like a job for the host-tenant given the global KV-level visibility required. Do we want to present a view over this table state for individual secondary tenants and their own ranges? To perhaps render their own minified view of hot ranges?
- We mentioned wanting to export the HHR data as a metric for Prometheus. It wasn't clear to me what this would look like, and how it would be rendered. FWIW, I think it's acceptable to not do this part, or at least right away, if it adds too much in the way of implementation complexity and time. It's important for this data to be rendered in the DB console (that's the out-of-the-box CRDB UI, right?) and for it to be visible through our cloud offering. Less important, I think, is making sure this data is available for on-prem customers running their own monitoring systems to be able to access it while the cluster's offline/damaged. The "visualizer" code we're building here is not an off-the-shelf one, so IIUC, prometheus can't just render what we export. For the offline, on-prem experience, I imagine needing to pull from this table periodically and be able to visualize it the same we do for
cockroach debug tsdump. Some text about this would help, even if listed as a non-goal. - Like Rafa mentioned, most crdb_internal.* tables are virtual tables; I believe what we want here is a system table (check out
SHOW TABLES FROM system;and their usages in the codebase, most subsystems use one or more system tables to drive themselves). - I recommend pulling up the "Visualizer" section to the start of the RFC. I think it'll help contextualize everything else that follows, and make it clear to readers what access patterns it'll have/need. I suspect that'll also help identify what we need from the backend + the perf characteristics we're after.
- While presenting a hot ranges visualization would be a great motivating short term win, I suspect that after fleshing that out, we'll immediately look towards other metrics that would benefit from the resulting infrastructure. To list a few: # of ops, bytes read/written, bytes stored, cpu utilization, latency (different percentiles), # of keys, amount of GC. With that in mind, it'd be beneficial IMO to frame this RFC with a generic metric in mind, and making sure what we build is not a one-off thing. I don't think this has many implications for the current design, but just worth keeping in mind for the schemas/aggregation pipelines we build.
- Given our desire to present a fixed # of key buckets, would we benefit from an additional level of indirection when storing statistics? Working backwards from the visualizer and framing it generically about representing a fixed scalar value per "cell", if we have 14 days of history being rendered in 15m segments, across 1000 key buckets, with each bucket represented by a 32-bit integer, the "data" alone would take up 43 MB, which thankfully is not that large.
((24*60*14)/15) * 1000 * 32 bytes = 43,008,000 bytes- Data for a 15m segment would be 32K.
- Does that change our equation for what needs to be indexed and what doesn't? If the aggregate data is this small, should we instead be querying 15m "blobs" based on the timestamp? Dicing it up by keys could be an alternative, but the mock ups suggest a view over the "every thing" keyspan when wholly zoomed out, and zooming in both vertically and horizontally to hone in on problem areas. If the 2-week data we're concerned with is at most 43 MB in size, do we need to dynamically fetch data sectioning by key? Or would fetching by 15m segments be sufficient? And with the entire blob loaded up on the client side, could we avoid dynamically fetching data by key segments?
- We do ultimately care about the actual keys in question. If you buy that indexing our stored data on keys is unimportant, I was imagining that each 15m segment "blob" would capture alongside it the metadata needed on the client side to render correctly it ("
buckets[N]maps to[/Table/42/1/"a", /Table/43/2/"b")"). It would be worthwhile spelling out the actual protos we want, both to persist to the internal table and to interface with over the wire with the client (could be the same proto). - Separating out the metadata in this manner, and using protobufs to store them in tables, would make it easy to add/remove fields without requiring schema changes.
- The RFC would defining the explicit interface the visualizer needs from CRDB to power itself. With an explicit interface, we could explore various strategies for aggregating metrics and persisting them. Implementing the interface could also happen independently. KV for e.g. has been thinking about more scalable forms of collecting metrics, and separately how to persist them. We don't have a super great story today, and it's a combination of stores doing it themselves, exporting to prometheus, sometimes gossiping it for other stores, other times exporting through HTTP end points accessible per-node. Given this RFC needs a driving process for statistics, we ought to consider that more fully. We also ought to separate concerns about what statistics we collect and what we persist. This is mostly in response to "Every store operates with a budget to guarantee that no more than 1000 ranges are recorded cumulatively by all nodes" and the "Range Reduction and Aggregation" sections, which could be a tricky thing to coordinate and would benefit from more details. Do we want a leased, singleton, centralized job to do the aggregation? Do we want per-store stats collection routines to be instructed by said centralized job? We've used jobs for this kind of pattern because it gives good recovery behaviour out of the box for the "process".
Reviewable status:
docs/RFCS/20222202_historical_hot_ranges.md, line 17 at r1 (raw file):
HHR will be persisted using an internal CRDB table. A budgeting and range aggregration scheme is proposed to ensure that the volume of HHR generated and queried does not introduce performance concerns. However, the aggregation is lossy, and could effect the utility of the data captured. To make sure users can gain meaningful insights, the aggregration scheme will dynamically increase resolution to ranges that are hot and will reduce resolution from ranges that are cold.

HHR will be visualized by a heatmap in DB Console. The heatmap will be similar in spirit to what is offered by Google Cloud's (Big Table and Spanner) Key Visualizer, and TiDB's key visualizer. The heatmap will visualize range hotness across time and keyspace.
[nit] Add references/links to the other systems mentioned?
docs/RFCS/20222202_historical_hot_ranges.md, line 30 at r1 (raw file):
1. Changing the definition and/or computation of the hot range metric, despite QPS having known issues.
    https://github.com/cockroachdb/cockroach/issues/50620<br/>
[nit] Stray <br/>
docs/RFCS/20222202_historical_hot_ranges.md, line 53 at r1 (raw file):
For each range, here is the information captured:
| Value      | Bytes |  description |
[nit] The text here appears malformed when looking at the raw text file. Surround with triple backticks? Ditto for the tabular views below.
docs/RFCS/20222202_historical_hot_ranges.md, line 74 at r1 (raw file):
___
[nit] I think the stray "---"s mess up the markdown formatting on reviewable.
docs/RFCS/20222202_historical_hot_ranges.md, line 224 at r1 (raw file):
[nit] Wrap the RFC text to 80 characters, I believe most other RFC documents in this folder do.
I think that should depend what kind of issues we want to investigate using this new functionality. If that is system level issues, then we should not expose that to tenants. If we want to use it as general purpose database performance tool, then we probably should, but in that case having a global QPS threshold and associated global limit doesn't make much sense as smaller tenants would be overshadowed by larger ones. That might be an opt in where your tenant range info is stored in tenant and uses your own storage quota and your own 1000 ranges maybe? |
 lidorcarmel
left a comment
lidorcarmel
left a comment
There was a problem hiding this comment.
Nice!
It would be great to explain in this RFC who the user is for this new tool:
- is it the product engineer that created the schema and now wants to see, for example, why some queries are slow?
- is it the DBA that tries to debug performance issues?
- is it the CRL Cloud SRE or L2 oncall? (I think no.. but worth mentioning)
Reviewable status:
docs/RFCS/20222202_historical_hot_ranges.md, line 48 at r2 (raw file):
3. The information captured for each range during sampling.

Clusters running production workloads could have 100K to 1M ranges. At any sort of reasonable sample rate, this would result in too much data captured. To reduce the number of ranges we collect metrics for, we can set a budget of 1000 max ranges. To populate these 1000 ranges we can use a mixed strategy of filtering out the coldest ranges and aggregating what remains. This is discussed in detail later on.
why is it too much? probably not because of storage cost? maybe bytes over the wire? but most of these bytes are never read, right? also, it's not clear to me why we're ok with losing resolution in large deployments - shouldn't we store more data for a 100TB cluster, compared to 1TB cluster?
Code quote:
too much data captured
 knz
left a comment
knz
left a comment
There was a problem hiding this comment.
Regarding your second bullet point, can you clarify if the section titled Metric Generation addresses your concerns? Do I need to add more detail here?
Yes, this is suitably addressed now. Thank you!
Looking forward to the next iteration where more comments will be addressed.
Reviewed 6 of 7 files at r1, 1 of 1 files at r2, all commit messages.
Reviewable status:
docs/RFCS/20222202_historical_hot_ranges.md, line 74 at r1 (raw file):
Previously, irfansharif (irfan sharif) wrote…
[nit] I think the stray "---"s mess up the markdown formatting on reviewable.
yeah they should be removed here and throughout, below.
docs/RFCS/20222202_historical_hot_ranges.md, line 48 at r2 (raw file):
Previously, lidorcarmel (Lidor Carmel) wrote…
why is it too much? probably not because of storage cost? maybe bytes over the wire? but most of these bytes are never read, right? also, it's not clear to me why we're ok with losing resolution in large deployments - shouldn't we store more data for a 100TB cluster, compared to 1TB cluster?
Historically we've been careful to talk separately about hot and cold data.
The scalability limits on crdb apply largely to hot data. It's mostly the hot data which we want to keep under control.
In a 10TB cluster (or 1M ranges), typically not all these TBs are hot. In our experience it's even rare.
However, comparatively, the hot ranges metadata will always be somewhat hot (at least warm), because it will be scrutinized regularly by DBAs etc.
So IMHO we should ensure that the hot ranges metadata remains a fixed % of the amount of hot data in a cluster, regardless of total data size / number of ranges.
docs/RFCS/20222202_historical_hot_ranges.md, line 53 at r2 (raw file):
For each range, here is the information captured:
| Value      | Bytes |  description |
nit: Description
docs/RFCS/20222202_historical_hot_ranges.md, line 54 at r2 (raw file):
For each range, here is the information captured:
| Value      | Bytes |  description |
| ---------- |------ | ---      |
nit: stray spaces around vertical delimiters
docs/RFCS/20222202_historical_hot_ranges.md, line 98 at r2 (raw file):
Every node operates independently, and once all nodes finish, `crdb_internal.historical_hot_ranges` will contain the results of the entire cluster-wide sample.

<br/><br/>
no need for these linebreaks.
docs/RFCS/20222202_historical_hot_ranges.md, line 120 at r2 (raw file):
<br/><br/>
ditto
docs/RFCS/20222202_historical_hot_ranges.md, line 145 at r2 (raw file):
1. What happens if the budget is > 128? This is relevant for small clusters with few ranges.

<br/><br/>
ditto
docs/RFCS/20222202_historical_hot_ranges.md, line 170 at r2 (raw file):
1. Would it suffice to send the first 10 or 20 characters of the `start_key`, trading resolution for performance? (Assuming we'd send the uuid too.)

<br/><br/>
ditto
 Santamaura
left a comment
Santamaura
left a comment
There was a problem hiding this comment.
Reviewable status:
docs/RFCS/20222202_historical_hot_ranges.md, line 33 at r1 (raw file):
    https://github.com/cockroachdb/cockroach/issues/73731

2. It is not an explicit goal to showcase a metric-agnostic aggregation, storage, and visualization scheme. However, parts of this RFC may be applicable to other high cardinality metrics we surface in the future. Future observability work my find this RFC helpful.
nit: typo my -> may
docs/RFCS/20222202_historical_hot_ranges.md, line 100 at r1 (raw file):
<br/><br/> This process is pictured here: 
Can we adjust the background color of this svg? I find it is hard to read vs others shown in the RFC.
docs/RFCS/20222202_historical_hot_ranges.md, line 143 at r1 (raw file):
Open Questions:
- What happens if the budget is > 128? This is relevant for small clusters with few ranges.
Another question I am wondering is (unless I missed reading it somewhere) is how much would we increase/decrease a budget? Is it by a fixed amount to some limits?
docs/RFCS/20222202_historical_hot_ranges.md, line 172 at r1 (raw file):
<br/><br/> The full querying process is pictured here: 
Same for the background of this one if possible.
docs/RFCS/20222202_historical_hot_ranges.md, line 177 at r1 (raw file):
____
### Visualization
I agree with Irfan here it might be nice to have this section further up as it may help with better giving context to the rest of the RFC.
docs/RFCS/20222202_historical_hot_ranges.md, line 186 at r1 (raw file):

Will we need to consider custom input date ranges for this feature/first implementation?
|
|
||
| HHR will be visualized by a heatmap in DB Console. The heatmap will be similar in spirit to what is offered by Google Cloud's (Big Table and Spanner) Key Visualizer, and TiDB's key visualizer. The heatmap will visualize range hotness across time and keyspace. | ||
|
|
||
| Finally, the aggregated hot range data will be exported as a Prometheus metric, for self-hosted customers to consume with their own monitoring infrastructure. This has the benefit of providing redundancy, where the metrics remain available even if the cluster and DB console are unreachable. |
There was a problem hiding this comment.
Given that we want to create differentiating features for cloud, do we want to provide this feature for self-hosted customers ?
There was a problem hiding this comment.
I will confirm this with product before we start implementing.
| 2. The sample rate, i.e. how often we collect metrics. | ||
| 3. The information captured for each range during sampling. | ||
|
|
||
| Clusters running production workloads could have 100K to 1M ranges. At any sort of reasonable sample rate, this would result in too much data captured. To reduce the number of ranges we collect metrics for, we can set a budget of 1000 max ranges. To populate these 1000 ranges we can use a mixed strategy of filtering out the coldest ranges and aggregating what remains. This is discussed in detail later on. |
There was a problem hiding this comment.
How does the sampling approach compare to collecting data for all ranges in the extreme case, but in practice reporting only when significant changes from the last report have occurred, and having coarser accuracy for colder ranges and better accuracy for hotter ranges. So some ranges would never be reported, while other will be reported very rarely, and others more frequently. In any case, not reporting unless there was a significant change can help with your approach as well. This can significantly reduce the communication and storage requirements, and you don't even need to run it in synced intervals. The downside will probably be slightly less efficient queries.
There was a problem hiding this comment.
This is an interesting idea. If we stored diffs when something interesting happens instead of snapshot values, we could support far more than 1000 ranges. However the 1000 range limit isn't only there to prevent storage requirements from ballooning, but also to keep the visualization performant.
I will keep this in mind moving forward.
| | Value | Bytes | description | | ||
| | ---------- |------ | --- | | ||
| | node_id | 2 | | | ||
| | store_id | 2 | | |
There was a problem hiding this comment.
How do you treat the replicas of a range ? It sounds like for now you're only talking about a single node/store, potentially the leaseholder. We will eventually have data that's per-replica, would you want KV to report that at the replica granularity, or some aggregate for the range ?
There was a problem hiding this comment.
I added a point in the Limitations section that discusses this. Per-replica metrics would be ideal. It might be best to let the consumer decide how to come up with an aggregate for the range.
| | qps | 4 | | | ||
| | start_key | <= 100 | locate the start of the hot range | | ||
| | end_key | <= 100 | locate the end of the hot range | | ||
| | timestamp | 4 | seconds since epoch | |
There was a problem hiding this comment.
Do we have information about the value size of a range ? I think this is important - 100 requests / second for a 10byte range is different than 100 requests/second on a 1M range. Again, this isn't something that needs to be accurate or reported every time, only upon significant change.
There was a problem hiding this comment.
Ack. We can record range size from mvcc stats.
| ___ | ||
| ### Metric Generation | ||
|
|
||
| According to the sample rate, every node in the cluster will collect metrics for a subset of leaseholder replicas that live on its stores. Then, every node will persist these metrics to `crdb_internal.historical_hot_ranges`. The stores are responsible for determining the subset and aggregation of leaseholder replicas that are recorded. Every store operates with a budget to guarantee that no more than 1000 ranges are recorded cumulatively by all nodes. At the time of sampling, existing samples older than 2 weeks will be deleted. |
There was a problem hiding this comment.
As an FYI, @andreimatei is leading the discussions around an approach where nodes will report their metrics to special servers that will aggregate these metrics and persist to storage. In any case, we need to make sure this works well in multi-region, where the cost of a write might be expensive if the leaseholder for that row is across WAN.
There was a problem hiding this comment.
One potential benefit of pre-aggregation is that we would perhaps be able to consolidate colder ranges into larger spans, further reducing the storage requirements for such ranges (users probably don't care about our range boundaries, although they might care about table or database boundaries).
There was a problem hiding this comment.
Thinking out-loud here, another potential benefit is if we can create very coarse-grained spans that can be presented initially by the dashboard. This will allow showing something quickly. Then, as the user zooms in, or maybe just gradually with time, we can improve the presented granularity.
There was a problem hiding this comment.
Big Ack. I've included a more explicit interface that shields the visualization from both observability infrastructure changes, and higher resolution metrics that we'll have in the future.
| The Key Visualizer has the following features: | ||
| - Time is represented by the x-axis | ||
| - Key space is represented by the y-axis | ||
| - Hotness is represented by a spectrum of color, with deep blue representing QPS activity equal to zero, and White equal to the max QPS activity seen across the time period being visualized. |
There was a problem hiding this comment.
Range size is very important to hotness in addition to QPS. Access density is sometimes used as a metric such as QPS per unit of storage.
 andreimatei
left a comment
andreimatei
left a comment
There was a problem hiding this comment.
Reviewable status:
docs/RFCS/20222202_historical_hot_ranges.md, line 36 at r3 (raw file):
### Visualization
I've read this, and it's still unclear to me how this visualization would work. There's an aggregated HotReplica structure that represents a key span with the sum of the QPS of multiple constituent ranges (which makes the name Replica dubious), but this structure is not referenced elsewhere in the RFC.
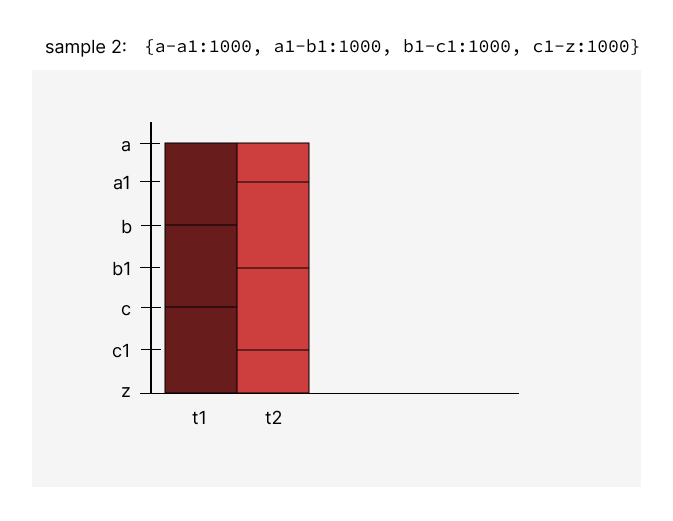
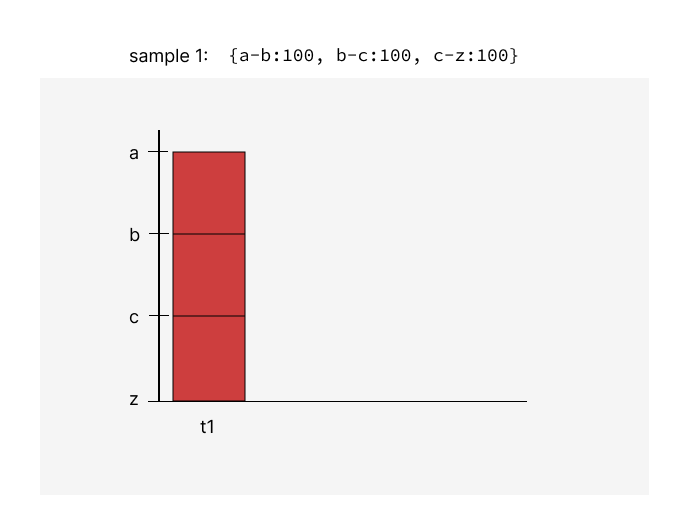
So, we're going to periodically write 1000 of these HotReplicas. It's not clear to me how we're going to draw them out when the keys don't align between subsequent samples. If sample 1 is: {a-b:100, b-c:100, c-z:100} and sample 2 is {a-a1:1000, a1-b1:1000, b1-c1:1000, c1-z:1000}, I think we have pixels for a-a1, a1-b, b-b1, b1-c, c-c1,c1-z, with two columns, right? Can you explain again what the value of each pixel is?
Relatedly, I was thinking that it'd be good to reflect empty key space in the visualization. I think that's generally hard - it's hard to tell how much data was in between two keys coming from different samples and what the QPS of that span was over time (for the example above, how much data is there between a-a1 and a1-b? But I think in an important special case we can know: at the end of tables and indexes. I'm thinking perhaps ranges that contain the end of an index could keep track of the last key in the range and could report that instead of the range boundary. This way, when an application constantly inserts at the end of an index (like when you have a timestamp index and you insert now()), the visualization could show a slanted red line over time that would be visually suggestive of what's going on.
|
@andreimatei Let me know if these illustrations clear things up. If they do, I'll include them in the RFC. As your scenario shows, the keys that we have metrics for will change over time, so the y-axis shows all key boundaries that were contained in samples between Tmin and Tmax. You're right - using the Regarding your last point, I plan on collecting the total bytes contained in a range (by using mvcc stats). Maybe we could use this to visualize range size over time, in addition to hotness. Is this what you mean by empty key space? Parts of the key space that hold little data relative to other parts?
Could you clarify - what's the difference between the last key in a range, and the range boundary? Isn't the last key in a range the range boundary? Thanks!
|
andreimatei
left a comment
There was a problem hiding this comment.
Reviewable status:
docs/RFCS/20222202_historical_hot_ranges.md, line 36 at r3 (raw file):
You've replied to me out of thread. I'm moving your reply here and further replying below. Otherwise the discussion gets confused between the PR-level thread and this thread. (I think one should rarely use the PR-level thread).
@andreimatei Let me know if these illustrations clear things up. If they do, I'll include them in the RFC. As your scenario shows, the keys that we have metrics for will change over time, so the y-axis shows all key boundaries that were contained in samples between Tmin and Tmax.
They help, yes, thanks. But my example wasn't very good, unfortunately. I'm trying to tease out whether the area of a box matters when determining the box's color. Like, if QPS stays constant, but a range splits, does the split have any visual impact? Say sample 1 is {[a-c):100} and sample 2 is {[a-b):50, [b,c):50}. Is the one box corresponding to sample 1 supposed to be hotter than each of the two boxes corresponding to sample 2? I think ideally we'd want all 3 to be the same color, indicating that the QPS per key (or, alternatively, per byte) stayed constant. I can see how a view where ranges are colored independent of their size can also be sometimes useful (say we're interested in the throughput of the shared resources within a range that don't scale, like some of the locks or the CPU bound of the leaseholder). So perhaps we could have a visualization that's per range and one that's per byte?
I'm also thinking whether the fact that the keys don't align across samples will result in too many visual artifacts because of the fact that we can't interpolate values within a box. For example, as a single hot key is captured by different ranges in different samples, its heat will smear across a somewhat different part of each column. The lid up parts will have some overlap (as the hot key is part of all of them), but that's about all we can guarantee. I was thinking that one thing we could do is choose a stable set of keys and maintain query counts relative to them. So, if you have one key in a range, that range keeps track of two counts - one on either side of the key. If you have two keys in a range, that range keeps track of 3 counts (e.g. if a range is [b,c) and we have stable keys {a1,b1,b2,c1}, the range would track queries for [b-b1), [b1-b2), [b2-c); the counts for [b-b1) and [b2-c) would be summed up in some processing step with the counts for [a1-b) and [c-c1), respectively. We'd still need some mechanism to allow this set of stable keys to evolve over time (so it's not necessarily all that stable), but the idea is that the keys would be independent from range boundaries.
On the other hand, with your proposal of using the range boundaries, we do inherently get some stability. And the idea of aggregating the cold ranges first helps. So I don't know if I really have anything here, but perhaps you can consider it.
You're right - using the
HotReplicaterminology when talking about aggregated ranges can be confusing. I'll address this.
Regarding your last point, I plan on collecting the total bytes contained in a range (by using mvcc stats). Maybe we could use this to visualize range size over time, in addition to hotness. Is this what you mean by empty key space? Parts of the key space that hold little data relative to other parts?
last key in the range and could report that instead of the range boundary
Could you clarify - what's the difference between the last key in a range, and the range boundary? Isn't the last key in a range the range boundary?
Well, I was trying to exploit the difference between keys that exist versus end of indexes. Like, the last row in an index might be /Table/100/3/42, but the range logically covers up to /Table/100/4. There's no index entries higher than 42, so maybe we can consider that the QPS of that key space is 0 (which is not necessarily true, because there can theoretically be reads there, but perhaps we ignore that possibility). Introducing a measurement of 0 for that key space would change how hotspots at end of indexes (which are common) look like. Assuming a constant QPS, and assuming the color of a range is not normalized to its size in any way, then I think an end of an index written to at constant QPS that keep splitting will look like this (assuming there's no load of the rest rest of the index):
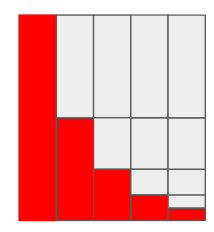
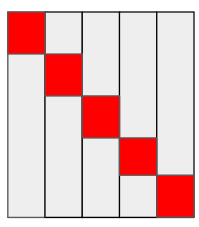
But, if we considered the empty key space to have 0 QPS, it could look like this, which is much better:
 zachlite
left a comment
zachlite
left a comment
There was a problem hiding this comment.
Reviewable status:
docs/RFCS/20222202_historical_hot_ranges.md, line 36 at r3 (raw file):
So perhaps we could have a visualization that's per range and one that's per byte?
Yeah, we can do that! It can be implemented as a mode that can be toggled on and off.
perhaps you can consider it.
Ack. I think the best thing that would solve the smearing problem would be higher resolution metrics, like in the future if we had metrics for keys instead of, or in addition to ranges.
it could look like this, which is much better:
I want to understand how this might be implemented. Does this sound reasonable? For every range, I would check to see if there's an index whose end key is less than the range's end key. I suppose there can be more than one index contained in a range, so I need to look for a difference between the range's end key and the last index's end key.
So effectively, the range ends where the last index ends? I would disregard the key space between the end of the index, and the end of the range?
andreimatei
left a comment
There was a problem hiding this comment.
Reviewable status:
docs/RFCS/20222202_historical_hot_ranges.md, line 36 at r3 (raw file):
I want to understand how this might be implemented. Does this sound reasonable? For every range, I would check to see if there's an index whose end key is less than the range's end key. I suppose there can be more than one index contained in a range, so I need to look for a difference between the range's end key and the last index's end key.
So effectively, the range ends where the last index ends? I would disregard the key space between the end of the index, and the end of the range?
When I wrote this, I was thinking that we already split at the end of each index. But I guess that's not true; we only split at the beginning of each table I think. So only the last index in a table has a range that ends at the end of the index. Except for regional by row tables, where each index is partitioned, so I think there each partition does have an end that corresponds to the end of the range.
The fact that not all indexes end on a range boundary is a bummer. But still, the way I was thinking we could implement this is with a relatively simple scheme: by detecting the case where an index (or also a partition of an index?) ends on a range boundary and, in that case, basically output a measurement of 0 QPS for a dummy range. For example, if we have a range [/Table/50, /Table/51), we'd treat that as two ranges for the purposes of the hot ranges measurements. Say that the highest key that actually exists in this range is /Table/50/4/100. Then the two ranges would be [/Table/50, /Table/50/4/100/0) and [/Table/50/4/100/0, /Table/51). The second one would be declared to have QPS=0. Assuming that the second range doesn't get aggregated with the first one because of the 1000 measurements limit (which shouldn't happen if the first range's QPS is high, right), then we'd get the visual effect that I want if the end of index 4 is hot.
In order to maintain the "highest key in a range", I was thinking we'd track the info about the highest key ever written to a range in the range's mvcc stats (which are stored both on disk and on each replica in memory, I think). On splits, we'd have to recompute this key for the left-hand side (LHS) range.
zachlite
left a comment
There was a problem hiding this comment.
Reviewable status:
docs/RFCS/20222202_historical_hot_ranges.md, line 36 at r3 (raw file):
Assuming that the second range doesn't get aggregated.
That's correct. For the example you gave, the ranges wouldn't be aggregated. I'm sure there's a scenario where the heuristic used to decide aggregation would be "wrong", so we can make sure to explicitly prevent aggregating dummy ranges.
Do you think dummy ranges should count towards the 1000 range budget? If they do count, we might take resolution away from another part of the key space that could benefit from it. If they don't count, we might store much more data than originally planned - I suppose worst case scenario twice as much, if every range also had a dummy range next to it.
detecting the case where an index (or also a partition of an index?) ends on a range boundary
Do you know how I would detect this? I think I understand the rest of the dummy range scheme.
andreimatei
left a comment
There was a problem hiding this comment.
Reviewable status:
docs/RFCS/20222202_historical_hot_ranges.md, line 36 at r3 (raw file):
Do you think dummy ranges should count towards the 1000 range budget? If they do count, we might take resolution away from another part of the key space that could benefit from it. If they don't count, we might store much more data than originally planned - I suppose worst case scenario twice as much, if every range also had a dummy range next to it.
I was thinking the dummy ranges would behave just like real ranges, so they'd count towards the timeseries limit. Since their QPS is 0, I think they'd usually be first in line to be merged into one of their neighbors, so I don't think they should usually hurt.
detecting the case where an index (or also a partition of an index?) ends on a range boundary
Do you know how I would detect this? I think I understand the rest of the dummy range scheme.
I'm imagining we'd check whether the end key of the range is the start of a table. A table's start key is a single varint.
If we'd want to detect the last ranges of each index partition, I'm not sure how to do it. I think maybe we could use the span configs and check whether the range's end key is present in the span config (this would also include table ends for non-partitioned tables). I think we currently do a range split at every key that has a span config associated with it, and I'm thinking perhaps it wouldn't be bad if we blindly gave the dummy range treatment to every range that was split from its right neighbor because of span configs.
zachlite
left a comment
There was a problem hiding this comment.
Reviewable status:
docs/RFCS/20222202_historical_hot_ranges.md, line 36 at r3 (raw file):
Previously, andreimatei (Andrei Matei) wrote…
Do you think dummy ranges should count towards the 1000 range budget? If they do count, we might take resolution away from another part of the key space that could benefit from it. If they don't count, we might store much more data than originally planned - I suppose worst case scenario twice as much, if every range also had a dummy range next to it.
I was thinking the dummy ranges would behave just like real ranges, so they'd count towards the timeseries limit. Since their QPS is 0, I think they'd usually be first in line to be merged into one of their neighbors, so I don't think they should usually hurt.
detecting the case where an index (or also a partition of an index?) ends on a range boundary
Do you know how I would detect this? I think I understand the rest of the dummy range scheme.
I'm imagining we'd check whether the end key of the range is the start of a table. A table's start key is a single varint.
If we'd want to detect the last ranges of each index partition, I'm not sure how to do it. I think maybe we could use the span configs and check whether the range's end key is present in the span config (this would also include table ends for non-partitioned tables). I think we currently do a range split at every key that has a span config associated with it, and I'm thinking perhaps it wouldn't be bad if we blindly gave the dummy range treatment to every range that was split from its right neighbor because of span configs.
I think this is something that will become more apparent when we (the KV Obs. team) start building this. The logic responsible for this dummy range scheme will be upstream from the rest of the aggregation logic, so if we need to make changes we can. We'll share our progress with you.
Big ACK on making sure that common scenarios are easily identifiable, so I appreciate your input here.
 koorosh
left a comment
koorosh
left a comment
There was a problem hiding this comment.
Reviewable status:
docs/RFCS/20222202_historical_hot_ranges.md, line 236 at r3 (raw file):
    -- When host sampling is being performed,
    -- tenant_id will be set to 'host'
Having tenant_id defined as an INT type cannot be set to host. Is it safe to use 0 as a reserved ID for a host? Or make it NULLable?
docs/RFCS/20222202_historical_hot_ranges.md, line 283 at r3 (raw file):
The sampling process is pictured here:  ajwerner
left a comment
ajwerner
left a comment
There was a problem hiding this comment.
The more I think about this proposal, the more I think it's important to reason about the keyspans in terms of SQL-layer concepts; I care that some part of the keyspace is hotter than another in an acute way, sure, but after I know that fact, I'll immediately want to understand how that portion of the keyspace corresponds to my workload. In many cases, I feel like after reaching an understanding that there is some interesting pattern somewhere, I'll want to dig into that pattern more-or-less exclusively in the context of specific table indexes. Is the hotspot the entirety of some small index? Is it one or two keys in some large index? Which index? Is the traffic pattern on some index periodic? Is it bursty? I'd love to get a sense for how visualizations over time and space will correspond to SQL-level understanding of the underlying keys.
In the extreme case, I might go so far as to say I'd rather have a visualization that showed me a list of indexes with just a couple of metrics: size, total load (in the dimensions laid out below), skew of load (maybe per unit size) and then only visualized individual indexes in a spatial dimension, I think I'd be quite happy. That's not to say that it's obvious how to do that for small indexes: it might not be. For large indexes though, it seems straightforward enough. When it comes to interpolating load inside an index, it makes me wonder about collecting some of the load-based split samples.
I'd like to understand how one might go from such a visualization back to workloads. We have query plans and statement fingerprints, could we ask the SQL-level data to tell me which part of the workload might be causing the load?
Another question is what do we mean by "hot"? Classically we've used raw QPS. This has always been somewhat questionable. TiDB uses https://github.com/pingcap/tidb-dashboard/blob/d02b6af853a3cac31c7a4c031347b8f6f9be9732/pkg/keyvisual/region/tag.go#L11-L18 which is pretty sound. I also am very interested in visualizing contention in the keyspace. I think this is something we most struggle with. Aggregate wait time per unit time on locks is something I wonder quite a bit about. Have you thought at how you might generalize the storage in more dimensions?
I'm also worried that the resolution we're talking about might not really be high enough. On the one hand, O(1000) per time segment per server feels like relatively high cardinality for a time series database, but to what extent we will be able to zoom in on anything in a cluster with 100k ranges and O(1000) indexes. Out of curiosity, do we have a sense of the scale of data which the tidb or bigtable visualizer collects data? The tidb one seems to have quite a bit of resolution. On some level, 285MiB over 14 days doesn't really feel like that much if there are more than 1000 ranges. 1000 Ranges is already 256 GiB unreplicated. Is there a way we can let folks spend more disk to get more data? The tidb folks seem to be doing single minute granularity across 4 dimensions and what feels like more than 1000 cells in the keyspan. Can we avoid painting ourselves into a corner by being too conservative? If I was willing to throw, say, 5% of my total storage at this problem, what sort of pictures could we draw? How could we then scale back from there and make it degrade gracefully?
Reviewable status:
zachlite
left a comment
There was a problem hiding this comment.
Hey Andrew, thanks for your comments and questions.
Regarding your points about understanding how all of this will relate SQL-layer concepts, I completely agree. There's some things we can do now, and things we can do in later iterations. I want to push back slightly on the notion that what's presented wouldn't provide any SQL-level insights at all. IIUC, a key self-reports the table and index it belongs to, and all of this information would be present in the visualization. I should have included a sketch of this in the RFC, but the user would be presented with this SQL information when they mouse over a specific cell.
Regarding observable patterns, Andrei pointed out that he'd like range splitting due to the end of an index being written to to look a certain way, presumably with the same goal in mind: To make specific workloads easily identifiable.
Does this alleviate your concern?
I do think we can do a better job of making insights more readily apparent. To limit scope, we left out the nice hierarchical schema visualization that Spanner's key visualizer has. Also, when brainstorming with design, we thought it would be cool to include embedded historical hot range visualizations for specific statements and transactions. Here, the visualization would only show the key space of concern relative to the statement or transaction. We could implement that same sort of SQL-to-key space filtering on the primary visualization. There's a lot we could explore here.
Another question is what do we mean by "hot"? Classically we've used raw QPS. This has always been somewhat questionable.
Ack. Maintaining the status quo was decided to just to limit scope. Higher resolution metrics seemed like its own project.
Have you thought at how you might generalize the storage in more dimensions?
Yeah, there's a couple of things that generalize really well. The implementation is hot range specific, but the idea is to make a visualization that parameterizes the attribute of the range that it is visualizing. Essentially it expects some value for some key space.
Regarding sampling and storage, I think the HHRSample proto could generalize the qps attribute to become metrics or something appropriately named.
I'm also worried that the resolution we're talking about might not really be high enough.
Ack. 1000 was "inspired" by Spanner and Big Table
I think this is something we'll answer pretty quickly through experimentation.
I agree, and I think it makes a lot of sense to give people the option to configure how much storage they'd like to trade for resolution, with a sane default to start out (perhaps this is 1000).
Reviewable status:
ajwerner
left a comment
There was a problem hiding this comment.
Thanks for engaging with my concerns. I've gone through in a bit more detail. I have no doubt that the end state here is going to be very valuable. I appreciate the way this has dragged on and I respect your patience throughout this entire process. This is a doozy of a first big project with a lot of competing concerns. The last thing I want to do is discourage you. This is really great work!
| message HHRSample { | ||
| message HotRange { | ||
| message Schema { | ||
| string database = 1; |
There was a problem hiding this comment.
Names in cockroach (and Postgres) have a three level hierarchy (database, schema, relation). In cockroach it's arguably 4 because indexes are children of tables.
There was a problem hiding this comment.
Ack. This schema definition is incomplete, because as you pointed out, I'm missing indexes.
| repeated int32 store_ids = 7; | ||
| repeated Schema schema = 8; | ||
| string locality = 9; | ||
| int32 bytes = 10; |
There was a problem hiding this comment.
Can you say a bit more about what this represents?
There was a problem hiding this comment.
Yeah! Alex Shraer pointed out that we'd like to know the bytes contained in a range, so this value will come from MVCC stats.
There was a problem hiding this comment.
What I'm getting at is: is this live bytes? Is this all bytes? Have you considered throwing more of the mvcc stats here?
Like one thing which would be insanely useful is to be able to use this tool to figure out if we're scanning over a lot of garbage. If we knew both the live bytes and total bytes and the read QPS, it'd tell a pretty compelling story.
| tenant_id INT NOT NULL, | ||
|
|
||
| -- info is defined below by `HHRSample` | ||
| info BYTES NOT NULL, |
There was a problem hiding this comment.
Can you help motivate the decision to use opaque protobufs in the storage here as opposed to sql columns?
Did you consider storing the individual samples as separate rows? Maybe keyed off of rank?
FWIW, one very valid reason to encode in chunks is that it gives an opportunity to do some bespoke compression via interning. In some cases, many ranges may have the same metadata and thus that could be deduplicated out. Similarly, keys could be prefix-compressed. I'm not saying you should do that, but that you could
There was a problem hiding this comment.
I'll get back to you on this.
There was a problem hiding this comment.
Can you help motivate the decision to use opaque protobufs in the storage here as opposed to sql columns?
It feels easier to evolve a protobuf definition over time than evolving a system table's schema. I also imagined at some level we would ship off protobufs to the front-end code rendering the chart -- I imagined shipping off these samples outright. For prefix compression, wouldn't it be easier to define it in protobuf form? (not saying we should do it either). Strawman:
message Sample {
  bytes shared_prefix = 1;
  message SpanStats {
    bytes start_key_suffix = 1;
    bytes end_key_suffix = 2;
    // stuff ...
  }
  repeated SpanStats span_stats = 2;
}
Is there a reason SQL columns are better? If the concern is around writing large binary blobs (ala system.jobs), we should give careful thought to what we include in our proto schema and also ensure that we're not rewriting things often.
There was a problem hiding this comment.
SQL columns are better because it's both easier and more efficient to query and aggregate them from SQL. I've noticed we've been having a bad time in statement stats largely because of the need to translate to and from json. Protobufs are even worse. Eliminating the possibility of the database performing computation on your behalf is almost certainly a mistake. There's a reason we don't sell a nosql database.
All of this is to say that I've got my head in a space where in the fullness of time this would not be a system table and would not be beholden to the severe compatibility burden of the database internals.
I also imagined at some level we would ship off protobufs to the front-end code rendering the chart -- I imagined shipping off these samples outright.
I think this is an anti-pattern. Sharing the durable data model on disk with the UI code leads to an impedance mismatch and hinders velocity. Pretty soon you forget that you don't need them to align. It's worth a thin translation layer up front to not incur tight coupling.
There was a problem hiding this comment.
I was also imagining what's stored in this table is already pre-aggregated. Is that not the case? It's already a cluster wide sample of what span statistics are over some time period, at which point the client code/thin translation layer would just read off of it with timestamps of interest (timestamps that do appear as columns for efficient access). If we envision other access queries (I would find it easier to know what they are if we pinned down the interface the client code needs from the backend), and they'd benefit from additional indexing, certainly we should add them as columns.
There was a problem hiding this comment.
Is it reasonable to say that we can generate the schema as proposed, fill it with 2 weeks worth of fake data, and see how it performs? (This is the current plan the kv-observability team is working on cc @koorosh)
There was a problem hiding this comment.
One thing I'm struggling with is how you'll render the keys given the boundaries move at each time step.
There was a problem hiding this comment.
sure. @ajwerner I'm going to move this to another thread.
There was a problem hiding this comment.
I figured that'd be far too many for comfort, but maybe that's just FUD on my part.
With the rows each having keys in them, I'm definitely worried about it. For 1M rows of just integers, I think it'd be okay. It'll be better when we get the column projection scans @RaduBerinde has been toying with.
I can also imagine some amount of normalization here where we map the values for each fixed bucket to then refer to some bucket metadata which lives longer than a bucket. By re-defining the buckets at each time step, we lose the ability to compress the metadata along that dimension. My sense is that that hurts from a data size perspective.
There was a problem hiding this comment.
I don’t have strong feelings on what the table layout should be. I think we’d benefit from defining first the interface we need the backend to provide, and then more specifically the storage layer powering it; both from the client code being powered by its contents and also the process that’s aggregating stats cluster wide and persisting it. Whether the storage is backed by a single table with protos, multiple without, or not even using sql tables in the future, are all things interfaces would add color to. It’s not clear that we’ve settled on the interfaces just yet.
|
|
||
| According to the sample rate, a job is executed to | ||
| request the 128 hottest replicas from every store via `replRankings`. These hot | ||
| replicas are then sorted alphabetically by their start keys. If tenant sampling |
| serves to decouple the visualization from changes to metric generation in the | ||
| future. | ||
|
|
||
| 2. By sourcing QPS values from `replRankings`, we are only recording leaseholder |
There was a problem hiding this comment.
This work is underway, no? Perhaps link some issues here and call it future work?
| differences manifest in how aggregation is performed to keep samples within | ||
| budget, and how the sampled metrics are written to `system.hot_ranges`. | ||
|
|
||
| According to the sample rate, a job is executed to |
There was a problem hiding this comment.
At what frequency is the job collecting data? Can we make this configurable?
There was a problem hiding this comment.
The job runs every 15 minutes. I don't know if it would be in the first iteration, but the sample frequency could be a cluster setting.
There was a problem hiding this comment.
Is the plan to use scheduled jobs? Do you think that'd be better than just perpetually running a job which sits and sleeps?
There was a problem hiding this comment.
Is the plan to use scheduled jobs?
Yes
Do you think that'd be better than just perpetually running a job which sits and sleeps?
When you say 'job' are you referring to pkg/job? I want to make sure that if that if a node dies, the sampling isn't cancelled or interrupted, and my understanding is that pkg/job makes sure of all that.
There was a problem hiding this comment.
Yes. For better or worse, both the regular "job" and "scheduled jobs" are in the same package. The scheduled job framework launches a job periodically. I'd recommend you consider using just a singleton job rather than a scheduled job. I think it'll be simpler and more flexible.
There was a problem hiding this comment.
Ok we'll check it out!
|
|
||
| ### Range Reduction and Aggregation | ||
|
|
||
| Range reduction and aggregation ensures that no more than 1000 metrics are |
There was a problem hiding this comment.
did you consider an algorithm that considered history? By that I mean, that looked at the previous aggregation decisions and tried to balance the desire to maximize resolution of hot ranges with the desire to keep aggregations stable between pairs of entries?
This aggregation section is the section I'm most concerned about when it comes to multiple dimensions. Is the idea that we'd store the same buckets but each bucket would have multiple dimensions or would we just copy-paste the entire structure for the different dimensions? The latter being multiplicative in the size of the storage.
I think we know quite deeply that the current metric is insufficient and we're actively fixing that. I want to make sure we don't paint ourselves in a corner here. Perhaps there's a way to sketch out an entropy metric that combines the different dimensions.
There was a problem hiding this comment.
did you consider an algorithm that considered history?
Yeah, the aggregation scheme will evolve over time. Using the previous sample to inform which part of the key space should have higher resolution is something I want to experiment with too.
Is the idea that we'd store the same buckets but each bucket would have multiple dimensions or would we just copy-paste the entire structure for the different dimensions?
This is a good question. I think it depends if the user expects multiple dimensions to be reported by the same aggregate ranges. If that's the case (and I suspect it will be), then it would be the former.
| repeated int32 node_ids = 6; | ||
| repeated int32 store_ids = 7; | ||
| repeated Schema schema = 8; | ||
| string locality = 9; |
There was a problem hiding this comment.
can you say more about what this is?
There was a problem hiding this comment.
This - https://github.com/cockroachdb/cockroach/blob/master/docs/generated/http/full.md#locality-5
Seeing how Locality isn't a string, I could stringify the value, or adjust the proto.
|
Would it be crazy to ask whether we can prototype this without building it into system tables and cockroach jobs? Just like, run a process and give it a pgurl? Any APIs and front-end should be totally portable, no? |
Link to the RFC text.