Fix memory leak caused by object pool and zero copy#2839
Fix memory leak caused by object pool and zero copy#2839bboreham merged 2 commits intocortexproject:masterfrom storyicon:master
Conversation
Signed-off-by: storyicon <storyicon@foxmail.com>
 jtlisi
left a comment
jtlisi
left a comment
There was a problem hiding this comment.
Great work figuring this out. This looks good to me and I’m excited to see what effects this change has on our environments.
 gouthamve
left a comment
gouthamve
left a comment
There was a problem hiding this comment.
Looks sane! Thanks for the deep dive into this!
|
May I ask how large the incoming messages are? E.g. how many samples do you allow per |
| // ReuseTimeseries puts the timeseries back into a sync.Pool for reuse. | ||
| func ReuseTimeseries(ts *TimeSeries) { | ||
| for i := 0; i < len(ts.Labels); i++ { | ||
| ts.Labels[i].Name = "" |
There was a problem hiding this comment.
Suggest // Name and Value may point into a large gRPC buffer, so clear the reference to allow GC
There was a problem hiding this comment.
I accepted your suggestion, thanks!
Signed-off-by: storyicon <storyicon@foxmail.com>
|
@bboreham Hello, in my production environment, the scrape_interval of Prometheus is
On average, the buffer for each |
|
Reproducing this problem is simple, I can give this Demo: Test0Running the above code, you can see that the memory usage of the program is Test1Uncomment the following code in You can see that the memory usage is Test2Change the following code in into: The memory usage should be only 30M+, because no zero copy is used, the |
|
(sorry my comments are somewhat duplicated in #2665) I understand the behaviour in Go of the part you fixed. What I don't understand is the gap between Go heap of 1-3GB and a RSS of 90+GB. In my Cortex clusters RSS is between 30% and 50% more than max Go heap. |
 pracucci
left a comment
pracucci
left a comment
There was a problem hiding this comment.
Thanks for working on this! Approving because I don't see any downside of doing it, but I would be glad to learn more about this, because it's quite surprising to me you're getting this benefit.
Few questions, please:
- Could you share a heap pprof showing the memory utilization without the fix?
- Could you share a graph to show how frequently the Go GC runs before and after the fix?
|
@pracucci I'm sorry I will provide these data later, because it is already late at night in my city. |
|
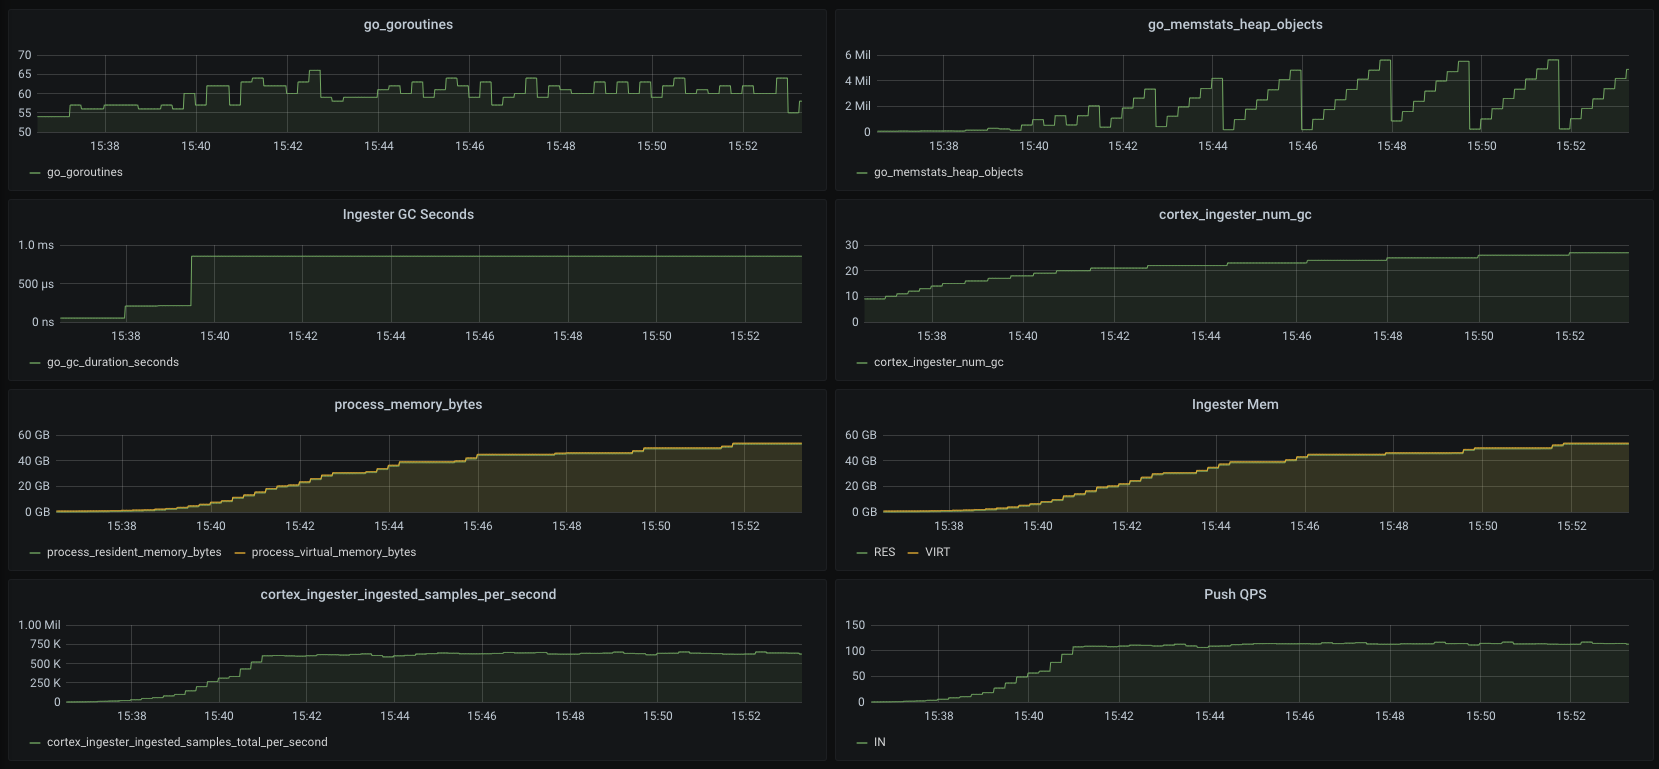
@pracucci The GC gap is huge and even exceeds my expectations. Before Fix
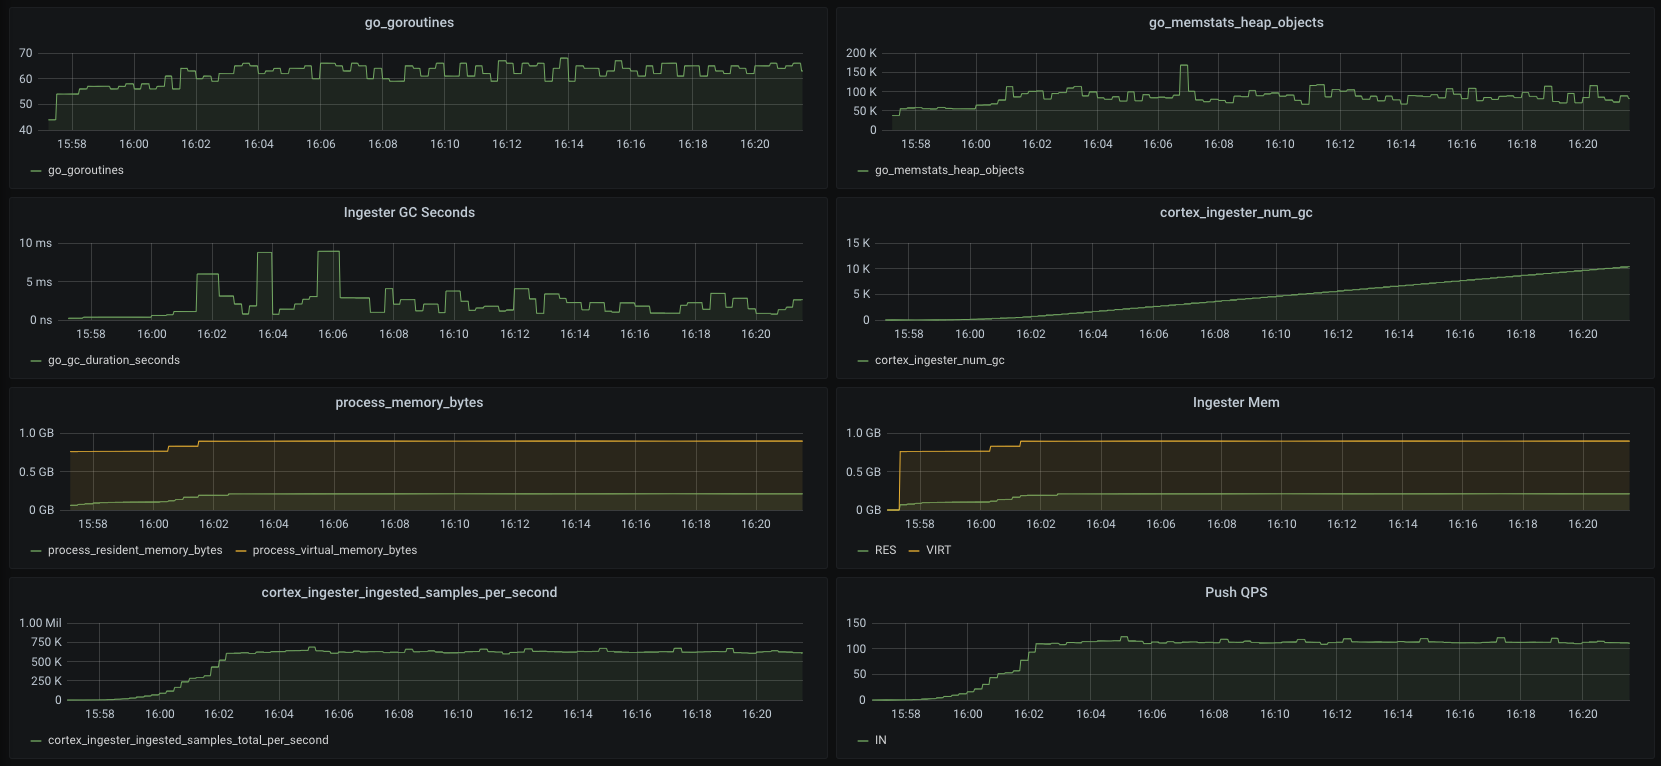
After Fix
In order to rule out other influences, I modified the Push function like this during whole testing(both The only difference between That is, the content submitted in this PR. The latest release version (cd9e38d) was used in the test. |
|
These charts looks something proving my gut feeling, that what you actually get is the GC running way more frequently. This explains why the "leak" is not visible in the heap, because it's all about how frequently the GC runs. |
|
@pracucci Your gut feeling is really great. Can you explain why GC just makes the number of heap objects drop, but fails to reduce ingester's memory resident? Do you think if I use ticker to manually trigger GC (Including |
I don't have an answer (I would need to further investigate it, possibly being able to reproduce it locally). Manually triggering the GC could be an experiment you can do just for testing, but if this PR fixes your issue then I would just be happy and move on 😉 |
@pracucci |
|
Go has a mechanism to control how fast GC runs - the Note frequent GC may chew up a lot of CPU. |
@bboreham |
Sorry I don't know what this refers to. |
Sorry, English is not my mother tongue. I mean what I explained in "Which issue(s) this PR fixes" |
|
Fixing the issue is fine; thank you for the PR. My last comment referred to manually running GC, which is a totally different subject. |
I understand, I haven't tried to use this function to control the behavior of GC. This is a new idea. I will continue to dive into it (includes manual triggering of GC tests), thank you! |
What this PR does:
The purpose of this PR is to fix the memory leak of Cortex Ingester. After this PR is merged, it is expected to reduce the runtime memory of Ingester by at least 30%.
Which issue(s) this PR fixes:
Fixes #2665
Although the PR code looks very simple, the principle inside is more complicated. I try to make it as easy to understand as possible. If there are errors in some parts, please correct me.
When troubleshooting the memory problem of Ingester, I simplified Ingester.Push to make it do almost nothing. Like below:
After the above modifications, Ingester still takes up very high memory (60G+), until OOM, I think it must be a problem with
client.ReuseSlice.However, when I commented out the reuse of TimeSeries, the problem was solved, Ingester only took up 700M memory, and it was very stable, like the following:
By looking closely at the code, I found the source of the problem. First, in
ReuseTimeseries,It does not release the real underlying array. We know that slice’s real structure is as follows:
The above operation will only change the Length in sliceHeader to 0, the underlying array still cannot be released. Secondly, you can see in the deserialization of Label:
cortex/pkg/ingester/client/timeseries.go
Line 205 in 8fe97dc
cortex/pkg/ingester/client/timeseries.go
Lines 232 to 234 in 8fe97dc
In the deserialization, the zero-copy is used.
Label.NameandLabel.Valuerefer to the original []byte, which will cause the original request body to not be released.This may have some abstractions, I can cite such an example:
The A request body has a total of 1M []byte (I call it
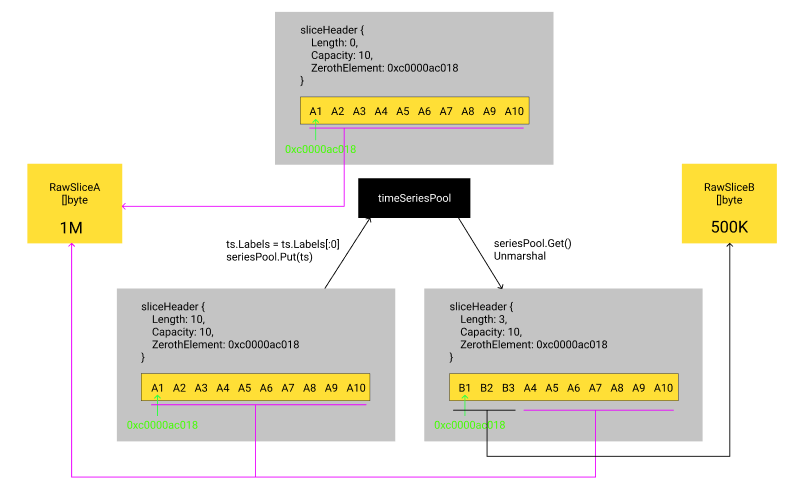
RawSliceA). After Unmarshal,timeSeriesA0contains 10 Labels. Due to the use of zero copy, these 10 Labels actually refer toRawSliceA.After the A request is processed,
timeSeriesA0is put intotimeSeriesPool, and the reference toRawSliceAis still not canceled at this time。The B request body has a total of 500KB []byte. After Unmarshal,
timeSeriesB0contains 3 Labels. In Unmarshal, it takes and reusestimeSeriesA0fromtimeSeriesPool. At this time,RawSliceAwas released?No,
RawSliceAmay not be released until the B request processing is completed, and even to the next request.The whole process is like this:
This example is a bit similar to:golang/go#23199
For the problems mentioned above, I have the following thoughts:
yoloString, because most of the bytes ofRawSliceare describing Labels, which is cost-effective.timeSeries, it can reuseLabelsandSamplesSlice.timeSeriesintotimeSeriesPool, must clear theNameandValueoftimeSeries.Labelsto dereferenceRawSlice.After testing, this modification can greatly reduce the runtime memory of Ingester without introducing new problems.
before:
after:
(The illustration above was made after commenting out Push's real logic)