Python library to read in bank account csv files and print out some financial graphs.
See example page for an example html output!
- Usable inside python notebooks (jupyter).
- Can generate interactive (javascript) local html pages.
- Categories can be defined by the user himself.
- Multiple bank accounts can be merged together.
- Annuity loans can be calculated and plotted as graph ouput.
The config.cfg file can be setup for your own requirements.
Files to be read in:
"csvFiles": [
		["DKB_giro", "/example_csvs/example_dkb.csv"],
		["Consors_giro", "/example_csvs/example_consors.csv"]
	],
Categories can be defined like this:
"categories": {
		"Overhead": ["Evil landlord", "Insurance"],
        "Orderings": ["Amazon", "Paypal"],
        "Housekeeping": ["Rewe", "Aldi", "Real", "Edeka", "E-Center", "Rossmann", "OBI", "LIDL"],
        "Gas": ["Aral", "Esso", "Shell", "Total", "Jet", "OMV", "ELO", "SUPOL"],
        "Income": ["Some Company"]
	},
The output file is by default:
"output": "example.html"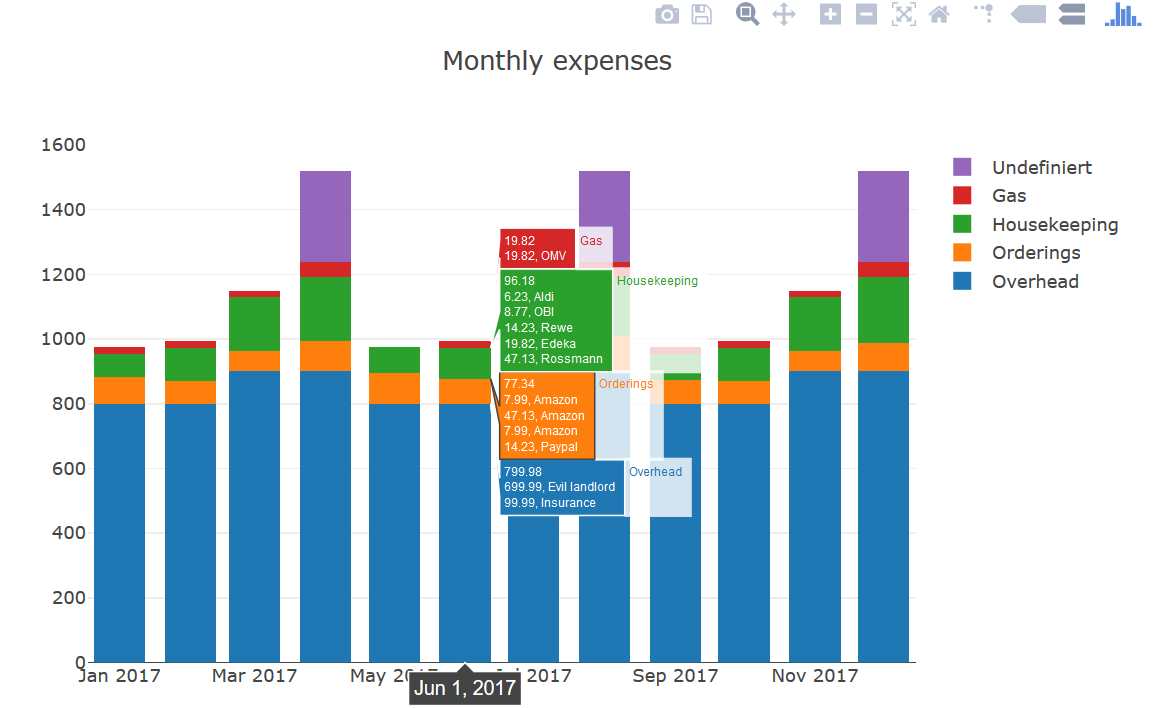
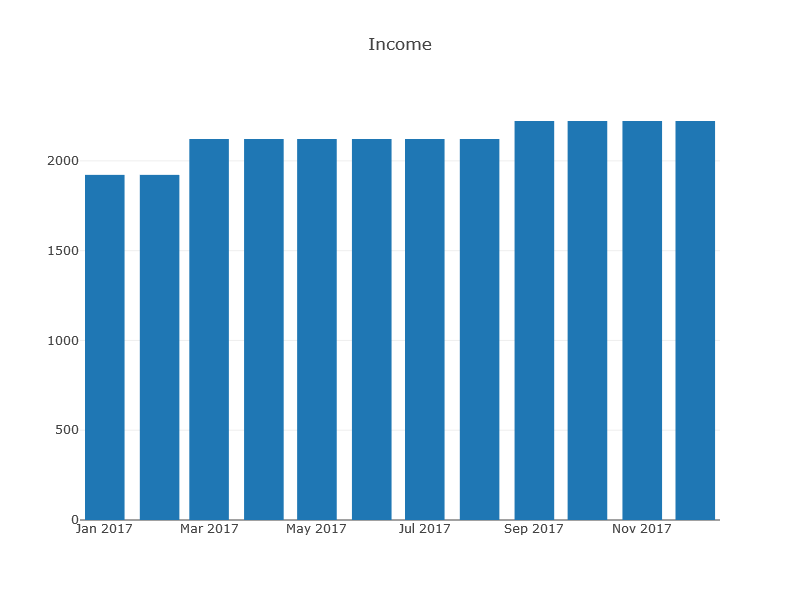


See example notebook for usage!