Home
Guidepost is a Python library for visualizing High Performance Computing (HPC) job data inside Jupyter notebooks. It turns a pandas DataFrame of job records into a single, linked, interactive overview — faceted heatmaps framed by histograms, a categorical bar chart, and a brushable color legend — so you can spot patterns in runtimes, queue waits, and resource usage, then export the exact records you care about back into Python.
| If you want to… | Read |
|---|---|
| Install and see your first chart | Getting Started |
| Understand what data Guidepost accepts and how columns are classified | Data Requirements and Type Detection |
| Map your columns to the chart (x / y / color / facet / categorical) | Configuration |
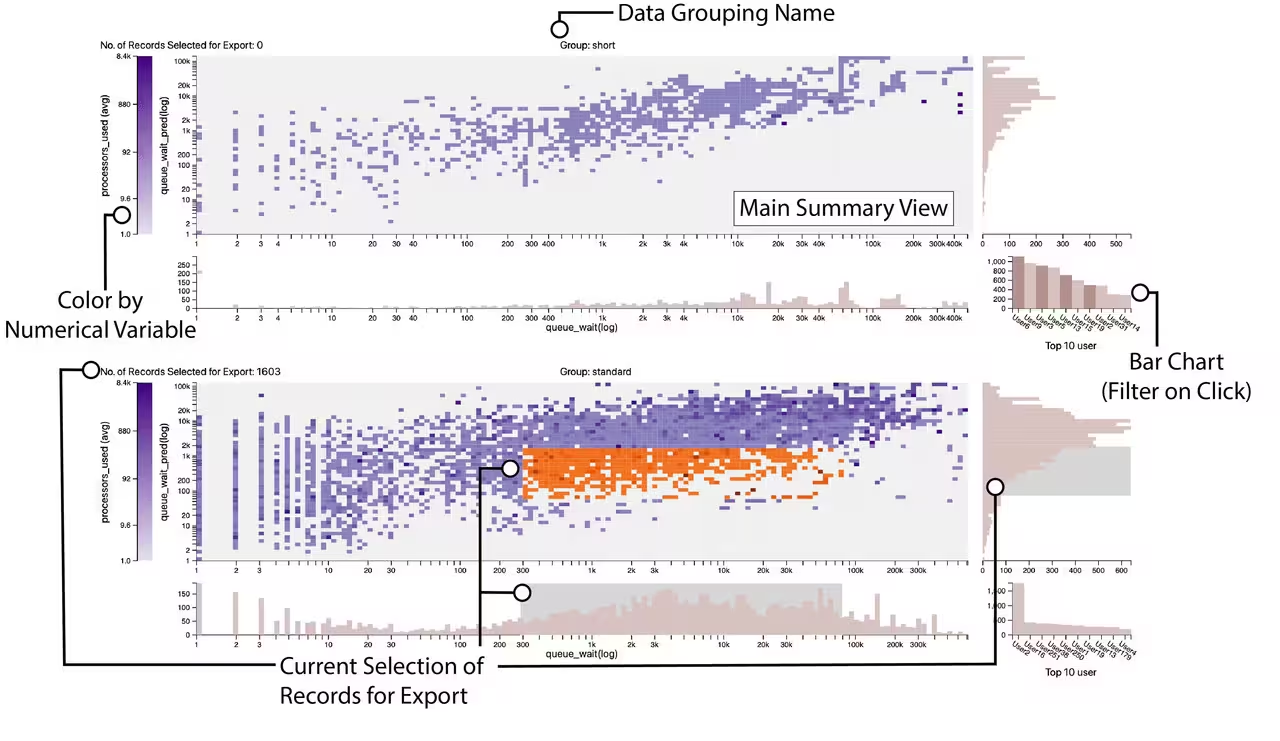
| Understand the panels and how they link together | Understanding the Views |
| Learn every heatmap interaction (pinning, brushing, modes) | Main Summary View Heatmap |
| Learn the histogram, bar chart, and legend interactions | Histograms Bar Chart and Legend |
| Select records and pull them back into Python | Selecting and Exporting Data |
| Look up a class, property, or method | API Reference |
| Hit a snag | FAQ and Troubleshooting |
-
Input: a
pandasDataFrame with at least 3 numeric and 2 categorical columns (datetime columns are supported on the x-axis). See Data Requirements and Type Detection. - Views: a Main Summary View (heatmap) framed by an x-axis and y-axis histogram, a categorical bar chart, and a color legend — repeated once per facet group. See Understanding the Views.
- Interaction: three heatmap selection modes (column-pin, cell-pin, 2D-brush), histogram brushing, bar-chart filtering, and color-range brushing — all linked. See Main Summary View Heatmap and Histograms Bar Chart and Legend.
-
Export: retrieve the brushed records as a DataFrame via
gp.retrieve_selected_data()orgp.selection.dataframe. See Selecting and Exporting Data.
A note on images in this wiki. GitHub wikis can only embed images that are either committed into the wiki repository (e.g. an
images/folder, referenced with a relative path) or hosted at an external URL. Several pages contain<!-- TODO screenshot -->placeholders where a captured image would help; drop the file into the wiki repo and replace the placeholder with.
Guidepost is developed at the National Renewable Energy Laboratory (NREL) with support from the National Science Foundation (NSF IIS-1844573, IIS-2324465) and the Department of Energy (DE-SC0022044, DE-SC0024635). Licensed under MIT. Questions: cscullyallison@sci.utah.edu.