v0.10.0 — the task graph, a UI in tabs

Tasks that wait on each other, and a UI in tabs to see them.
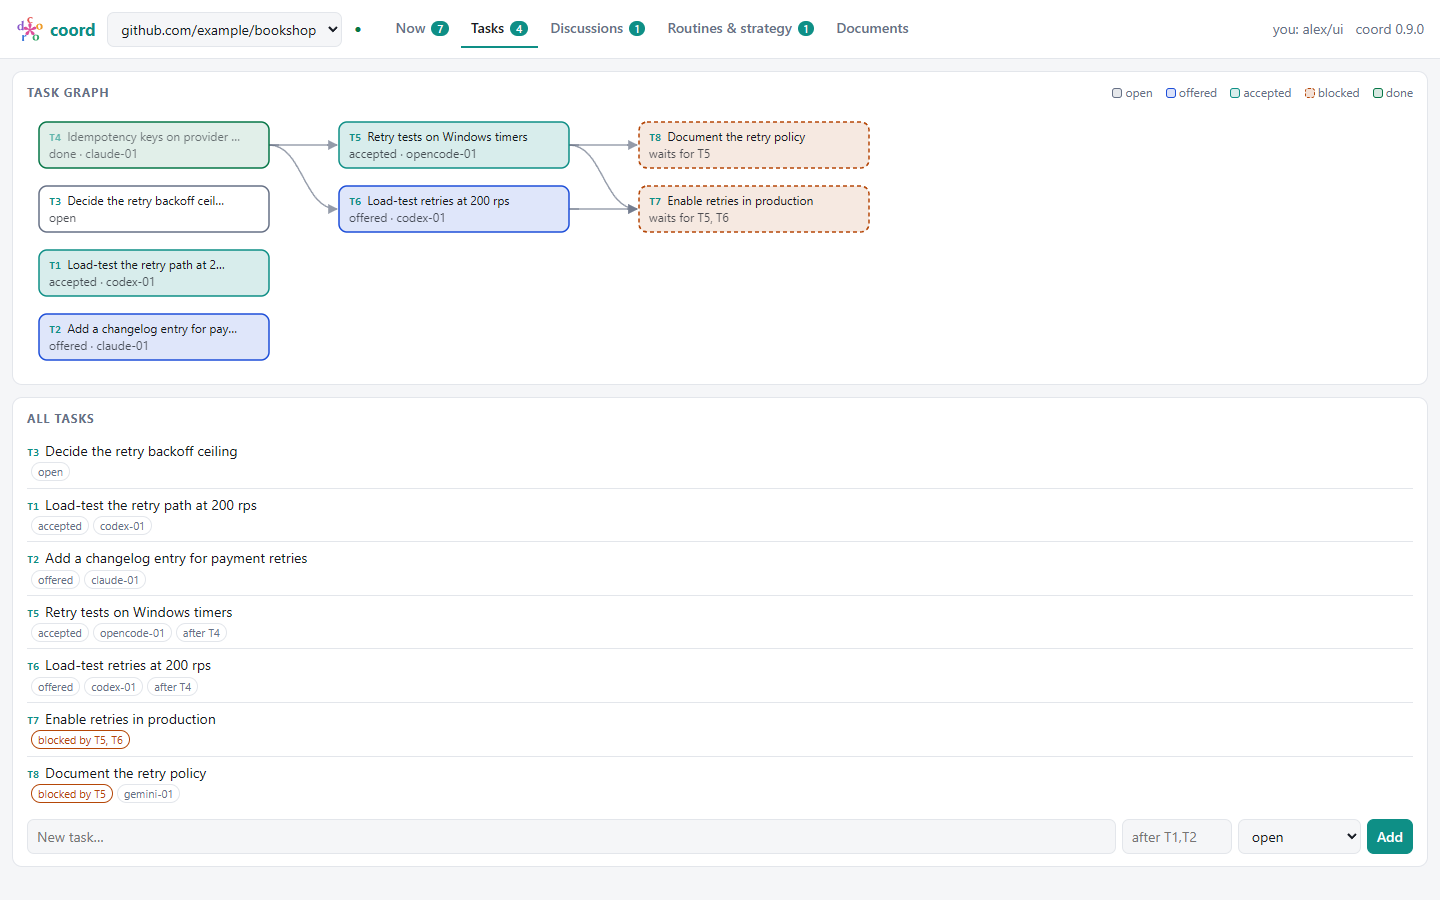
The task graph
coord task create "Enable retries" --after T5,T6, or latercoord task link T7 --after T5(--removeto unlink). Same project only; cycles are refused.- A task waiting on unfinished prerequisites is blocked: it can be offered, not accepted (
blocked, withblocked_by). When the last prerequisite is done - or cancelled - whoever the task is for gets "T7 unblocked". coord tasksshowsblocked by T5, T6/after T4;coord tasks --graphdraws the forest in text;task showlistsafter,blocked_byandbefore.
The UI in tabs
- Now: sessions, claims, the message feed, plus Waiting for someone (open questions and warnings, tasks offered and not yet accepted) and the routines due.
- Tasks: the graph as SVG - prerequisites on the left, one column per depth, ordered to avoid crossings, blocked tasks dashed - and the list, with a field to create a task after others.
- Discussions, Routines & strategy, Documents. Badges count what needs attention; the tab you chose is remembered.
Upgrading from 0.9.0
uv sync, restart coord-server (a task_deps table is added on open); refresh plugin copies.
Install
uv tool install https://github.com/datamoc/coord/releases/download/v0.10.0/coord-0.10.0-py3-none-any.whl
npm install -g https://github.com/datamoc/coord/releases/download/v0.10.0/coord-client-0.10.0.tgz
Tested: test_coord.py 48/48 and the TS suite 25/25 on Windows; the UI checked in Edge at 1440×900, light and dark, no console errors.