Building a Frontend Dashboard App with Backend Graph Integration
First, run the development server:
npm run dev
# or
yarn dev
# or
pnpm dev
# or
bun dev
Open http://localhost:3000 with your browser to see the result.
You can start editing the page by modifying app/page.tsx. The page auto-updates as you edit the file.
This project uses next/font to automatically optimize and load Inter, a custom Google Font.
Deployed Link :- https://orange-farm.vercel.app/
Github Repo Link :- https://github.com/developer208/OrangeFarm
Down Sampled Graph Api :- https://orange-farm.vercel.app/api/data
Desktop-Width :- 1440px
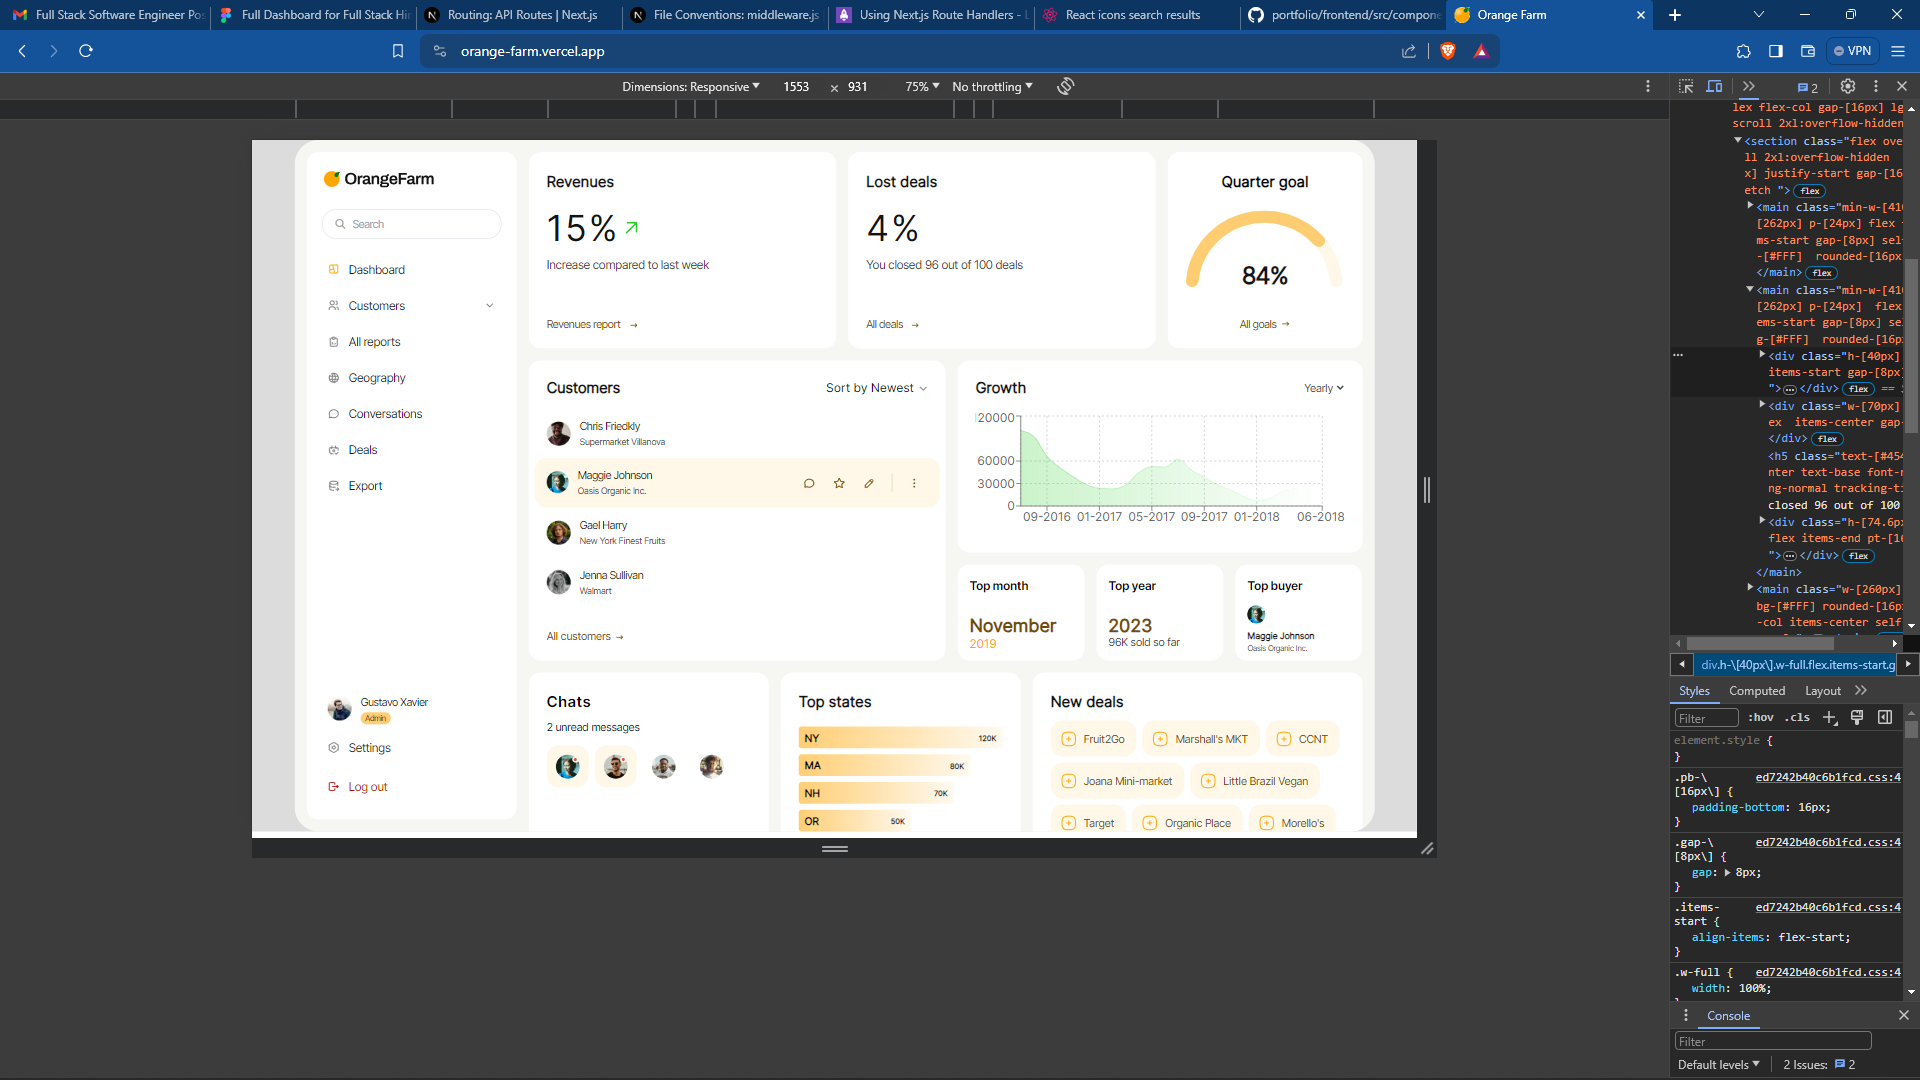
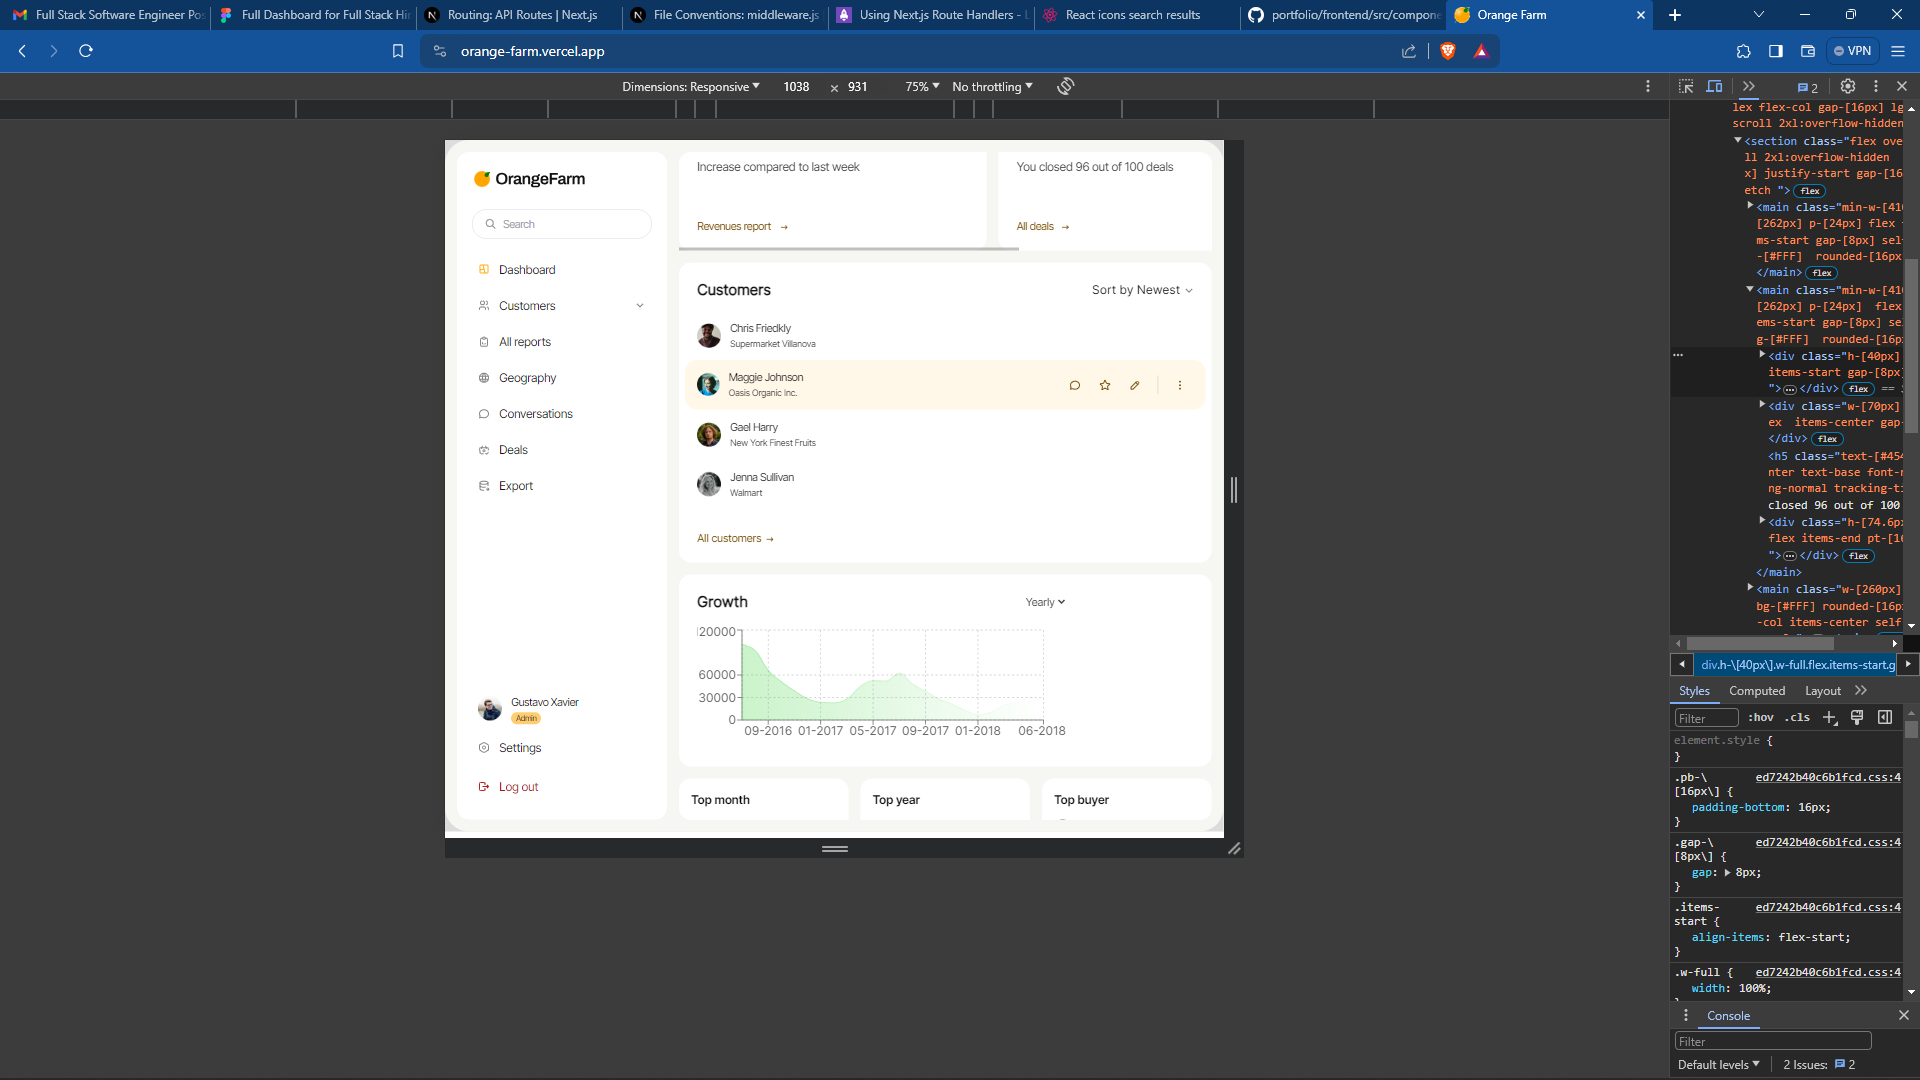
Tablet-Width :- 960px
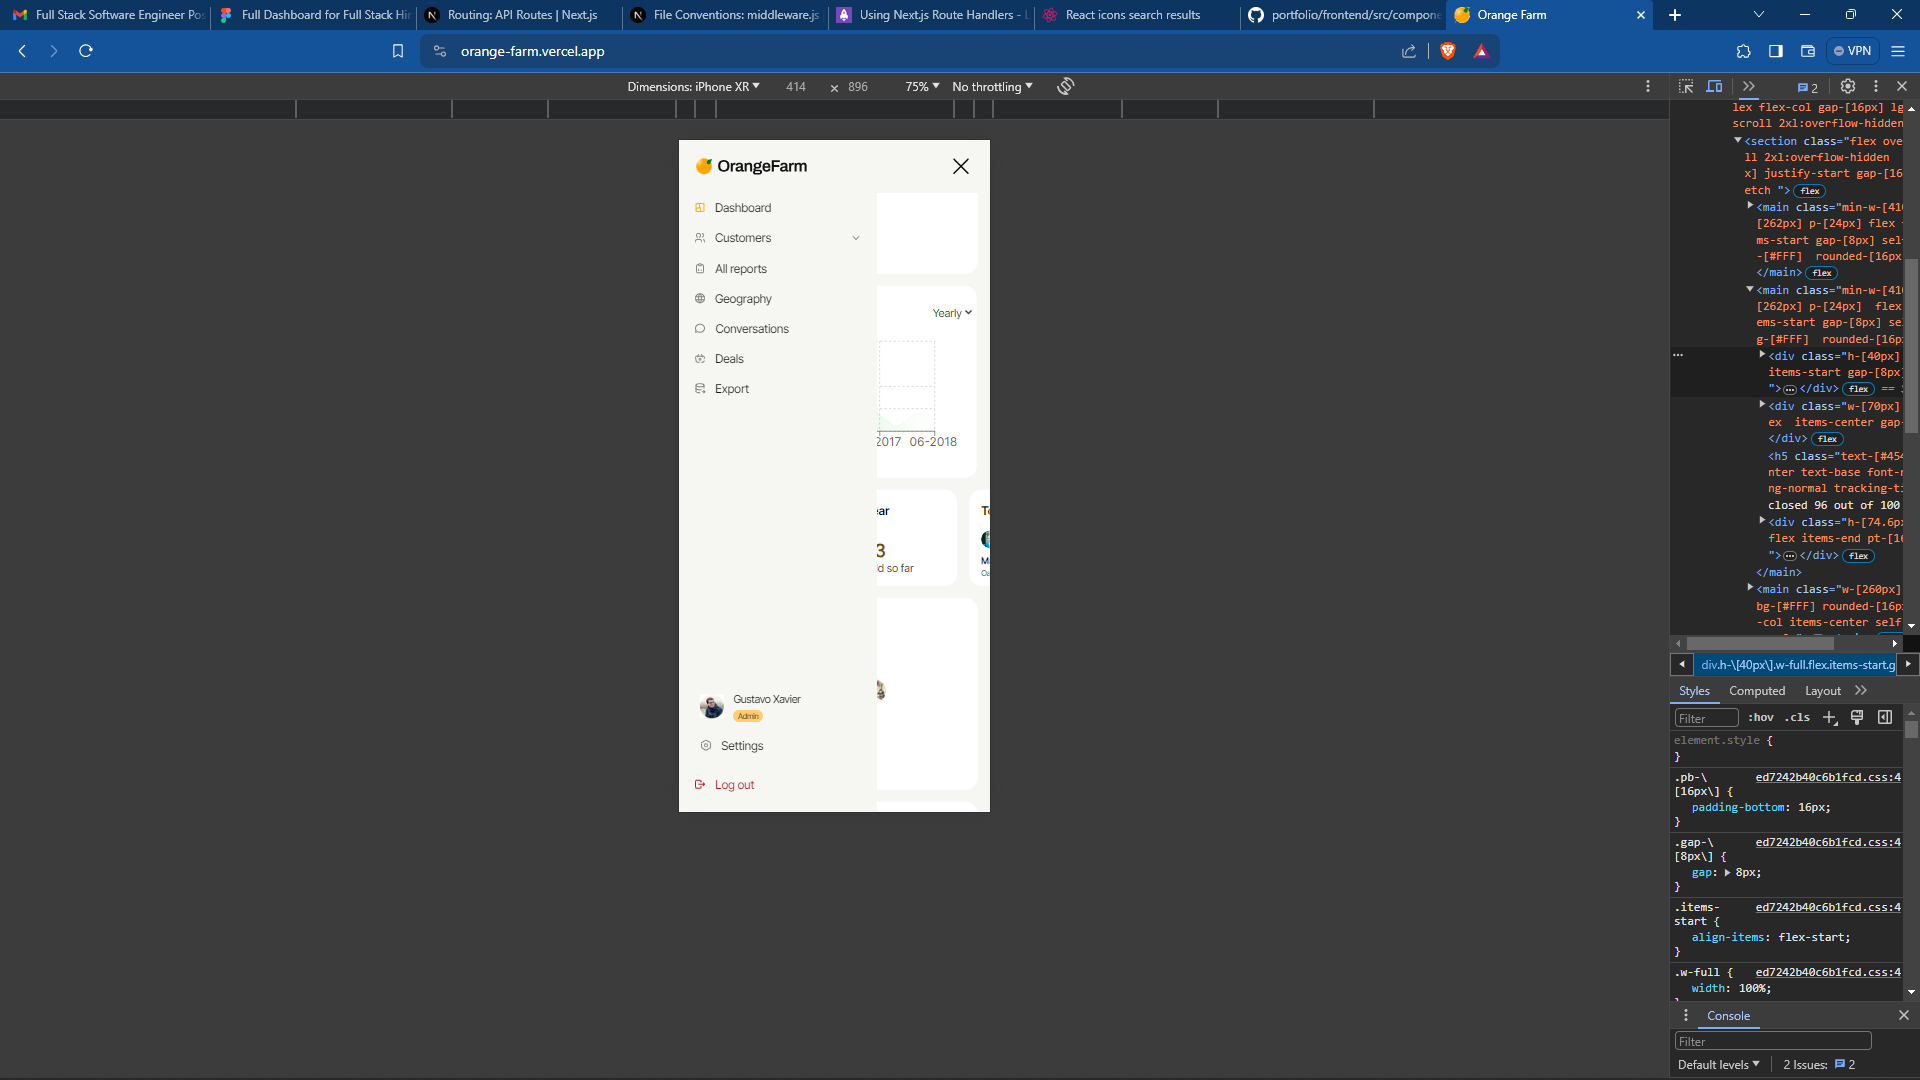
Iphone XR-Width :- 440px
- Next JS 14 App Router
- Css Framework - Tailwind Css
- Graph Library - recharts
- Icons - Table-Icons
- Extra Icons - react-icons npm package
- Next JS as a Backend Framework
- Api Creation
- dataset.csv
It is same as in dsa we find frequency of each element in array Worst Case Time Complexity - O(N*2) Worst Case Space Complexity - O(N)
Data Structure Used :- Map Time Complexity :- get() - O(N) set() - O(1)
for (let i = 0; i < data.length; i++) { const prev_arr = data[i].Timestamp.split(" "); const prev_new_array = prev_arr[0]; const prev_str = prev_new_array.substring(3); const val = Number(data[i].Profit_Percentage); if (map.get(prev_str) === undefined) { map.set(prev_str, val); } else { let curr = map.get(prev_str); map.set(prev_str, curr + val); } }