Performance Profile
When the pipeline is ran with the -P parameter, performance metrics including the CPU, GPU and memory usage will be recorded during processing. This information is then collected and displayed in a Jupyter notebook. This requires Python, Jupyter, and if using GPU CUDA acceleration, nvidia-smi. Performance metrics are captured using the following applications: top, vmstat, iostat, nfsiostat (these are stock in most Linux distros) and nvidia-smi. Output from these are captured and stored under a logs directory inside the ExSeq directory. After the pipeline finishes running with the -P option, python scripts under tests/perf-profile/ aggregate the generated logs into csv files which are then read by the python notebook created perf-measurment.ipynb. Jupyter when run, will open the system default web browser with a new tab with the python notebook which displays plots of the capture data.
This section contains some examples of the plots available in the created perf-measurment.ipynb notebook. This is not an extensive list of all plots and tables created.
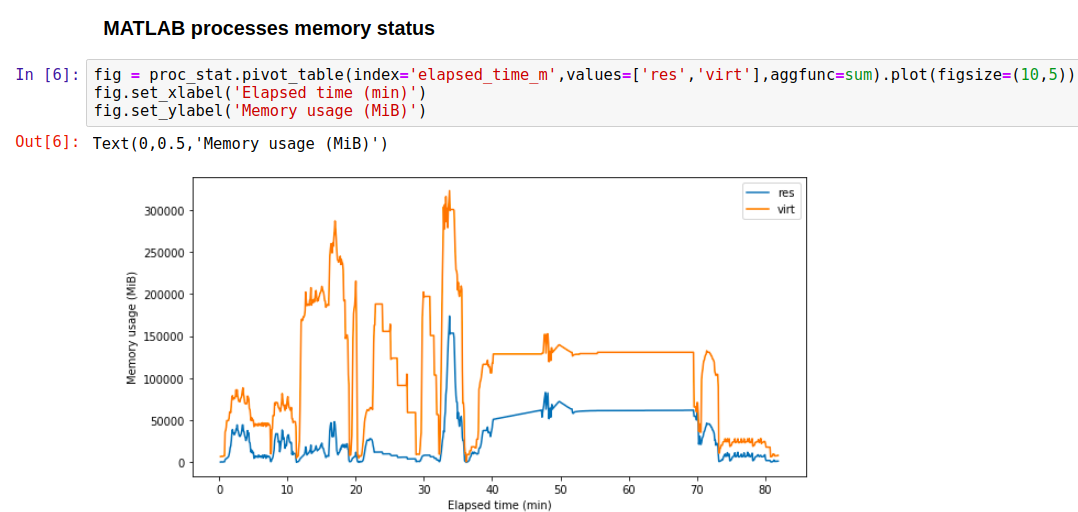
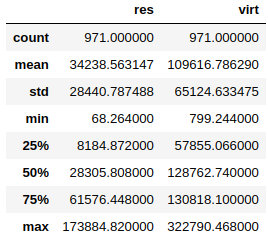
This example shows what part of the jupyter notebook looks like as well as a plot of the memory usage of the pipeline over time and a table showing the summary of the usage. This plot is generated from the "res" and "virt" columns from the top process. The blue line stands for resident and shows the RAM usage where as the orange virtual line shows all memory including swap. The resident memory is bound by the amount of RAM in the system (that is if the process' resident memory would exceed the total amount of RAM available on the system an out of memory error would occur) whereas virt is bound by available disk space.
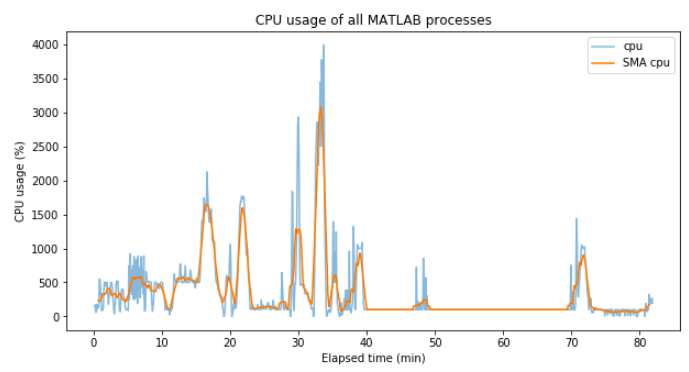
This plot shows CPU utilization and the Sliding Moving Average of the utilization. This plot was generated on a machine with 40 cores using GPU acceleration. The plot is in percentage of cores used so a utilization of 4000% would mean all cores are being fully utilized.
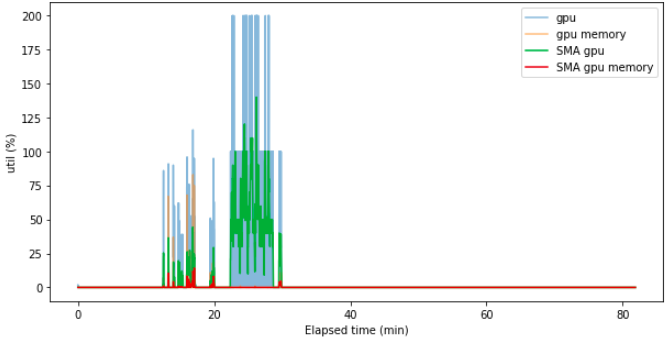
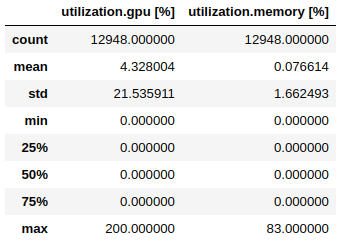
This example shows the GPU usage over time (both core and memory usage as well as the SMA for both).
One issue that can arise when running the pipeline on a remote server is Jupyter will by default open a web browser on the remote machine. Depending on the distance to server interactions with the user interface of the browser can be slow. To alleviate this, it is possible to run the browser locally and the Jupyter server remotely. To do so start the Jupyter server on the remote system with:
jupyter notebook --no-browser --port=8887
The server will start in that terminal window without opening a browser and print diagnostic information of the server including a link with a security token to the server like:
http://localhost:8887/?token=4a8c84dbb27d5ba54c9f1c126a20f8d9a6fc69e31ba4461a
Then on the local machine open up a terminal and run:
ssh -N -L localhost:8887:localhost:8887 user@remoteMachine
replacing the last parameter with relevant user / machine. This forwards connections to the local port to the remote port and allows the earlier link to be opened in a locally running web browser. This allows for easier viewing of the notebook.