GPS Elevation Data
2021-06-06
- Types of elevation data
- Using GPXAnalyzer to merge pressure sensor data with GPS data
- Using OruxMaps to calculate elevation from pressure sensor data
- Calibrating elevation data
- Merging temperature data
- Calculating CEG and CEL
Obtaining accurate elevation data for a GPS track is difficult. Elevation data is never 100% accurate, and the errors depend on how the elevation data was collected and calculated.
GPS elevation data is the most common data, but it is the least accurate.
When your GPS device generates track points, it collects the time, latitude, longitude, and elevation. Because the GPS satellites are scattered throughout the sky in a more-or-less horizontal plane, the vertical (elevation) accuracy is not as good as the horizontal (latitude and longitude) accuracy. In a canyon or among trees, fewer satellites will be available and the signal may bounce around, and accuracy will be even worse.
For example, here is a chart of raw elevation data as collected by the GPS on my phone. It was collected over a 30 hour period and the phone remained stationary during the time.

The elevation varies by about 120 feet.
Some GPS devices may filter the elevation data to smooth out the high frequency noise. Similarly, some analysis programs filter the elevation data. However much of the variation in GPS elevation measurements occurs over minutes and hours, and will not be removed by a simple high-frequency filter.
Many dedicated GPS devices (and some phones) come with a built-in barometer/altimeter, and they use the barometer for elevation data.
Generally, barometers/altimeters do a pretty good job with relative elevation changes, but they are not very accurate in an absolute sense. In addition, they are affected by the weather, as well as by diurnal (24 hour) and semi-diurnal (12 hour) changes in the base pressure.
To get accurate elevations, you must "calibrate" the elevation data. This might be done as infrequently as once a day, or as frequently as once every 30 minutes.
One simple way to calibrate your pressure data, known as manual calibration, is to adjust all the data so that the elevation is correct at a known location. For example, if you know the elevation at the start of your hike (say by reading the elevation from a topo map), you can adjust the data up or down so that the starting point is at the correct elevation. Subsequent elevations are measured relative to that location, and will be fairly accurate.
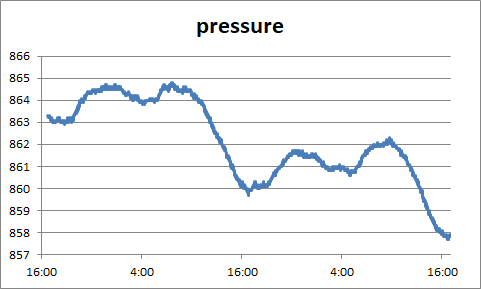
This does not, however, account for gradual changes in pressure throughout the day nor for changes in the weather. For example, here is a plot of the pressure (as measured by a Tempo Disc device) during a 48 hour period at a fixed location. There were no "fronts" or other large weather changes during the two days.
The pressure changes about 7 hPa (millibars) during this time. You can see the diurnal and semi-diurnal changes, as well as a change from one day to the next. If you convert these pressures to elevations, the apparent elevation changes by over 220 feet during this period.
Another way to calibrate elevation data is to calibrate the barometric elevation data to the GPS elevations. If you do this over a relatively long time (say an hour), you average out most of the errors of the GPS elevation data.
Many dedicated GPS units use barometers to measure elevation, and use the GPS to perform auto-calibration along the way. However, the manufacturers generally do not provide information on how often calibration is performed or exactly how it is calculated. Usually calibration is performed at the beginning of a track, but when and how it is adjusted after that is unknown. If you do a hike where you return to your starting point, you will often find that the ending elevation differs from the starting elevation, sometimes by several hundred feet.
Calibrated barometric elevation data is less noisy and more accurate than GPS elevation data. For example, here is a chart of a recent hike I did. The blue "input" line is the GPS elevation data. The orange "output" line is elevation based on a Tempo Disc pressure sensor, calibrated using the GPS data.

The barometric elevation data is smoother and more symmetric. This was an out-and-back hike, so the elevation data should be left-to-right symmetric about the center. Neither line is perfect, of course, but the barometric elevation data is better than the raw GPS elevation data.
A DEM (Digital Elevation Model) is a database of known elevations for many points on the earth—ideally millions or billions of points—sometimes derived from topographic surveys but more often from orbiting radar or lidar. High-resolution DEMs can produce pretty good estimates, especially for roads and other places where the trees have been cleared and the remote-sensing spacecraft can see clearly all the way to the surface. They are less accurate over forested areas.
There are a variety of online and offline tools that can replace your GPX elevation data with DEM data. For example, gpsvisualizer.com is a free online service that can plot and analyze your data, including using DEM data for elevation. Topofusion is a windows application that can download DEM data and use it when analyzing a GPS track.
DEM data is probably better than GPS elevation data, but not as accurate as barometric elevation data. It is sometimes used to calibrate barometric data.
If your GPS device does not have a barometer, you can use a Tempo Disc device to collect pressure data and then use the GPXAnalyzer application to convert the pressure data to elevation and merge this data into the GPX file produced by your GPS. You can also merge the temperature data collected by the Tempo Disc.
The Tempo Disc 4-in-1 Bluetooth Sensor Logger is a small (1.3" diameter) sensor device which can measure temperature, relative humidity, and pressure. It is made by Blue Maestro and retails for about $40. It can report data to your phone in real-time and can log the data to its internal storage so that you can download the data at a future time.
If you collect pressure and temperature data at the same time as you collect your GPS data, GPXAnalyzer can merge the pressure and temperature data with the location data in the GPX file and produce a new GPX file with barometer-based elevation data and (optionally) temperature data. The end result is a GPX file with more accurate elevation data than produced by the GPS alone.
See Merge Tempo Disc sensor data into GPX files for a step-by-step description of how to do this.
The merge process is based on time. Each track and track-segment is processed separately. For each track point in the GPX file, GPX analyzer will find the timestamp of the track point and look that up in the pressure data. It will find the pressure readings before and after the track point and interpolate between the two based on the timestamp of the track point and the timestamps of the before and after pressure data.
If your GPS device does not have a barometer, you can use a Tempo Disc device to collect pressure data and convert it to elevation using OruxMaps, which is a mapping application for Android phones.
The latest version of OruxMaps from the Google Play Store (version 8.1.8 or later) includes support for the Tempo Disc 4 in 1 Sensor. When you connect OruxMaps with your sensor, OruxMaps will use the barometric pressure from the sensor to determine the elevation.
OruxMaps will calibrate the sensor elevation using the GPS elevation. It does this at the start of recording a track, and apparently also during the track. The frequency of this calibration, and the exact algorithm used, are unknown.
OruxMaps will also merge the temperature data from the Tempo Disc sensor into the GPX file.
This technique is more convenient than using GPXAnalyzer, because the barometric and temperature data is automatically handled by the mapping application (OruxMaps). There is no need for a separate step on your PC to correct the elevation data. However, the calibration in OruxMaps does not appear to be as accurate as GPXAnalyzer. OruxMaps calibrates in real time, so it only affects data points in the future. GPXAnalyzer has the advantage of having all the data available simultaneously, so it can calibrate over the entire track.
Barometers are quite good at providing relative elevation data, but they do not provide accurate absolute elevations. To get accurate elevations, you must "calibrate" the elevation data.
GPXAnalyzer has various calibration options, which are discussed below. In most cases you should use option "C Linear fit in 1 hour sections".
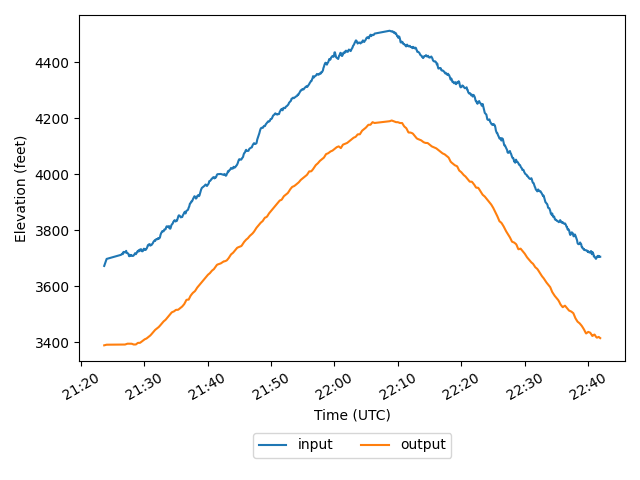
If you select the "0 None" option, no calibration will be performed. The pressure based elevations will be offset vertically from the GPS elevations. For example, in this chart the blue input line is the GPS data, and the orange output line is the elevation based on Tempo Disc pressure data with no calibration applied.
The "A" option adjusts the pressure elevations so that they match the GPS elevations when averaged over minutes 5 to 10 of the data. We skip the first 5 minutes of the file because when a GPS unit is first turned on the first few data points are often erroneous (in both position and elevation).
Here is the same data but calibrated with option A:
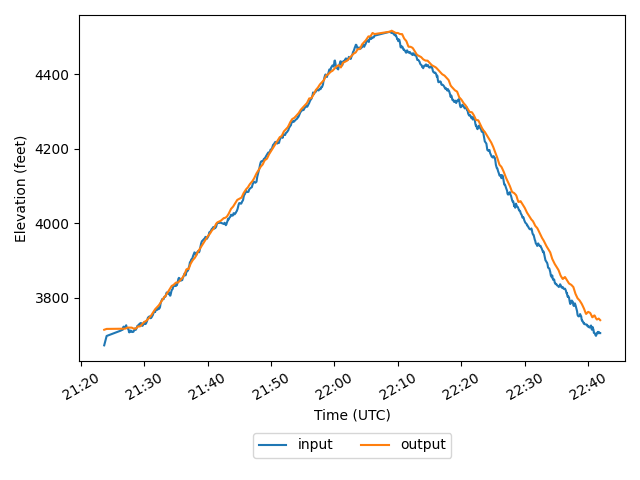
Notice how the GPS elevation data (blue input line) at the far left shows an initial low elevation that quickly climbs to match the following points. This is a typical start-up error for GPS elevation data. It is ignored by the calibration routine, since we skip the first 5 minutes and average over minutes 5 to 10.
Also notice how the pressure based elevation data (orange output line) at the right has drifted higher than the GPS data. This is due to a gradual pressure change over the hour and 20 minutes of the hike.
The "B" option is similar to the "A" option, except that it averages over the entire file instead of minutes 5 through 10. It ignores the first 5 minutes of the file for the same reason as option A.
Here is the same data but calibrated with option B:
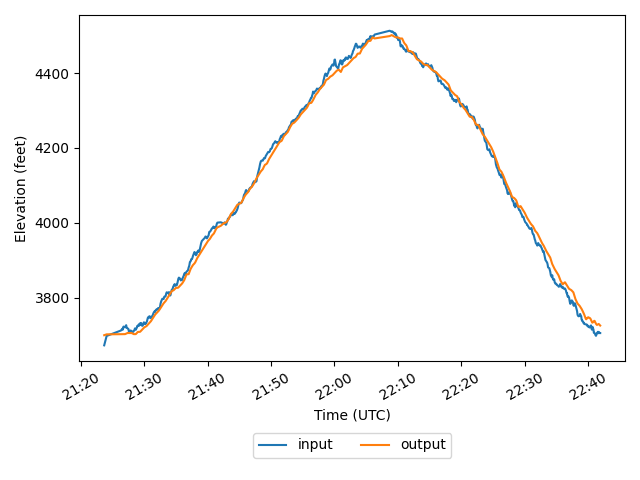
The GPS elevation data (blue input line) at the far left still shows an initial low elevation.
In this case, the the pressure based elevation data (orange output line) is below the GPS data on the left of the chart, and above the GPS data on the right of the chart. It's not as obvious as calibration method A, but the same problem is affecting the data. Gradual pressure change over the hour and 20 minutes of the hike is causing apparent drift in the elevation.
Calibration method "C" attempts to adjust for gradual pressure changes by recalibrating each hour of the GPS file.
As with other calibration methods, it ignores the first 5 minutes of the file to skip any start-up errors.
After that, it breaks the GPX file into equal length sections that are about 1 hour long. The actual section length may vary, from 30 minutes to 1 hour and 15 minutes, depending on the length of the original GPX file.
It then calculates the average difference between the pressure based elevation and the GPS base elevation for each section. That adjustment is applied to the center point of the section. Between center points, the adjustment is interpolated (linearly) so there is a smooth transition between adjustment values. At the beginning and end of the data, there is about 30 minutes where the adjustment is extrapolated based on the values at the two adjoining section center points.
Here is the same data calibrated with option C:
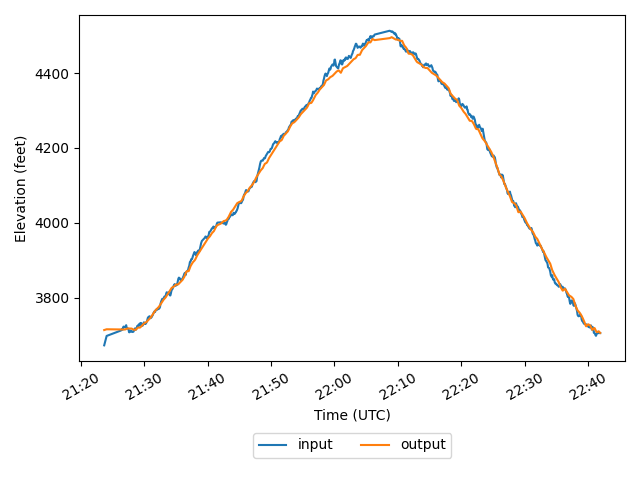
The GPS elevation data (blue input line) at the far left still shows an initial low elevation.
But now the starting and ending points of the hike match each other, and align well with the GPS data.
This data was collected using an Android phone running Orux Maps, as well as a Tempo Disc device. I also collected GPS data using a Garmin GPSMap 66st device. Here is a chart comparing the two. The blue input line is the pressure based elevation calibrated using GPXAnalyzer method "C". The orange diff line is the Garmin elevation data.
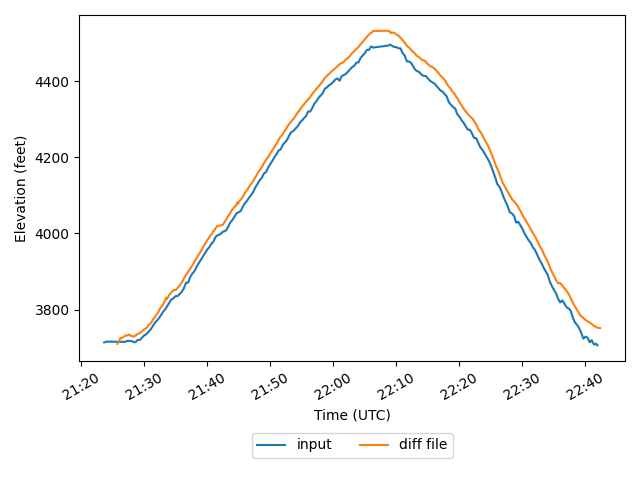
From this chart it appears that the Garmin unit is calibrated at the start of the hike, and is not re-calibrated during the hike. Garmin units are reputed to recalibrate occasionally, but this is a short hike (about 1:20) and we don't see any evidence of recalibration.
There is a short rise in the Garmin data (orange) at the beginning of the hike which is probably a start-up error. This may be the source of the offset between the Garmin data and Orux/Tempo Disc data. The Garmin data also drifts higher over the track, so the end of the hike is about 27 feet higher than the start. Of course the Garmin is hampered by the fact that it is reporting data in real time; it cannot go back and "fix up" data earlier in the track. GPXAnalyzer has the advantage that it can analyze and adjust all of the data for calibration.
For GPX files that are shorter than 1 hour long, GPXAnalyzer will fall back to a simpler calibration algorithm.
-
If the track segment is less than 5 minutes long, it calibrates by taking an average over the entire file.
-
If the track segment is between 5 and 10 minutes long, it calibrates by taking an average over the final 5 minutes of the file. This skips the initial part of the file (between 0 and 5 minutes long) in an attempt to avoid start-up errors.
-
If the track segment is between 10 and 60 minutes long, it applies calibration method A or B if specified, but if you specify method C it will fall back to using method B.
GPXAnalyzer is also capable of merging temperature data from the Tempo Disc sensor into a GPX file. This has no effect on the elevation data and is enabled with a simple check-box on the GPXAnalyzer screen.
The temperature data is added to each point in the GPX file based on the time of day. It will find the temperature before and after the track point and interpolate between the two based on the timestamp of the track point and the timestamps of the before and after temperature data. If there is any existing temperature data in the GPX file it will be overwritten.
The resulting GPX file is similar to one produced by Garmin GPS units which have a temperature sensor such as the Garmin Tempe temperature sensor. You can open this file in Garmin BaseCamp and see a graph of the temperature during your hike.
The Tempo Disc temperature sensor is quite accurate; the spec says ±0.7°F maximum. But when used for hiking or other outdoor activities they are not very accurate due to environmental conditions. If you carry the device in your pocket it is affected by your body heat. If you carry it in your pack the sun will heat up your pack and the temperature will rise accordingly. Similarly if you suspend it from your pack in a place where the sun can reach it (even part of the time), it will heat up from sunshine. Suspending it also makes it more susceptible to damage. At night or under heavy overcast the temperature reading is good, but if there is any sun you can see 10 or 20 degrees or more of temperature rise from the sun.
One of the more troublesome elements of GPS elevation data is calculating Cumulative Elevation Gain (CEG) and Cumulative Elevation Loss (CEL). CEG refers to the sum of the gain in elevation over a track segment. Elevation losses are not counted in this measure.
CEG is used by hikers, bikers, runners, and others to estimate how difficult a trip will be. A four mile hike over level ground is very different from a four mile hike that climbs 3,000 feet. For example, one rule of thumb, called Naismith's rule, estimates the length of the hike by allowing 1 hour for every 3 miles forward, plus an additional hour for every 2,000 feet of elevation gain.
The difficulty is not in the calculation itself, but in the fact that the elevation data is never 100% accurate. If there is any noise in the elevation data that causes the reported elevation to bounce up and down, all the "up" measurements will be included in the CEG.
For example, consider this hike which consisted of a steady climb to a peak, then turning around and descending to the starting location.
The blue input line shows the elevation as reported by the GPS. The orange output line is the elevation based on Tempo Disc barometric data.
The elevation difference between the peak and the end of the hike is 790'. This is a pretty good estimate of the actual CEG of the hike. The climb is steady; there are a couple of places where the trail levels out, but it does not go up and down.
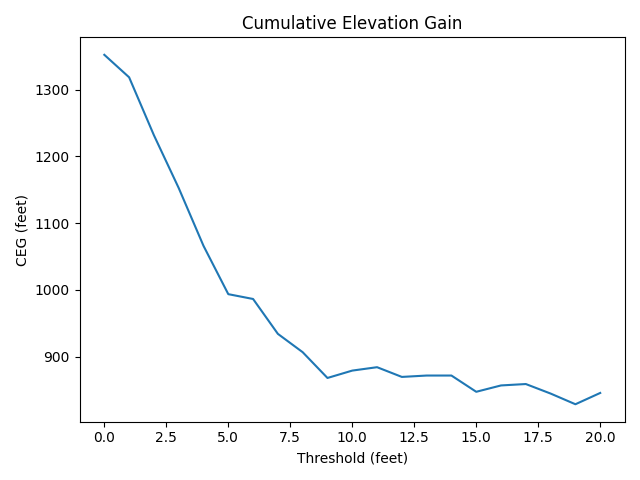
GPXAnalyzer calculates the CEG of the GPS elevation data as 1352' and the CEL as -1320'. (The difference between the CEG and the CEL is due primarily the start-up error at the beginning of the hike.) This is 1.67 times the actual elevation gain!
When run on the Tempo Disc elevations, GPXAnalyzer calculates the CEG as 816' and the CEL as 824'. This is still a little high, but it's much closer to an accurate value.
There are several ways we can deal with this problem and generate more accurate CEG and CEL values.
- Use barometric elevations rather than GPS elevations when possible.
- Use DEM elevations rather than GPS elevations, if available.
- Smooth the elevation data using a filter.
- Apply an elevation threshold to the CEG/CEL calculation.
GPXAnalyzer can perform any combination techniques 1, 3, and 4 above.
Other programs and GPS devices may apply smoothing filters or elevation thresholds as well. Unfortunately they rarely tell you how they are "correcting" your data. For example, Garmin's Basecamp program calculates CEG and CEL (which they call Ascent and Descent). From the values given it's clear that they must be doing some sort of filtering and/or thresholding, but they don't document how they arrive at their numbers, and I have been unable to duplicate their values.
GPXAnalyzer can apply a smoothing filter to the elevation data. You can select from 5 different filtering options via a pull-down (or command line options).
- 0 None
- A 3-point average
- B 5-point average
- C 7-point average
- D (0.3, 0.4, 0.3) weighted average
Options A, B, and C are simple "boxcar" or moving average filter. They average the data over a 3, 5, or 7 point window.
Option D is also a 3-point moving average filter, but it weights the points differently. The center point is weighted a little higher than the two points on each side.
GPXAnalyzer also has an option to apply the filter function multiple times. If you apply an evenly weighted moving average filter multiple times, it approaches a Gaussian weighted filter.
Another technique you can use is to apply an elevation threshold during the CEG calculation. This only counts an elevation gain or loss after it has passed a certain vertical threshold.
This means that when calculating gain or loss, we will ignore any point that is less than the threshold distance. For example, say you have elevations of:
    1:  0
    2:  5
    3:  4
    4:  8
    5:  9
    6:  1
    7:  5
    8:  9
And use a threshold of 6. The first point is your starting elevation. The next two points are under the threshold, and are ignored. The 4th point (value 8) is larger than the threshold, and gives you CEG so far of 8. The 4th point now becomes your new starting point and you repeat the process. Point 6 (value 1) is more than 6 below your current starting point so you reset your starting point to that value. Point 8 (value 9) is more than 6 above the value 1, so that give you another CEG value of 8.
The GPSVisualizer website has a good explanation of this algorithm at https://www.gpsvisualizer.com/tutorials/elevation_gain.html.
GPXAnalyzer allows you to set the elevation threshold to use for CEG/CEL calculations. It also has an option to calculate CEG at every integer value up to and including the value you enter. And there is an option to plot the values.
For example, here is a chart of the CEG calculated on that same up and down hike that we have been looking at. This is calculated using the GPS elevations.
And here is the same chart, but calculated using barometric based elevations from a Tempo Disc sensor.
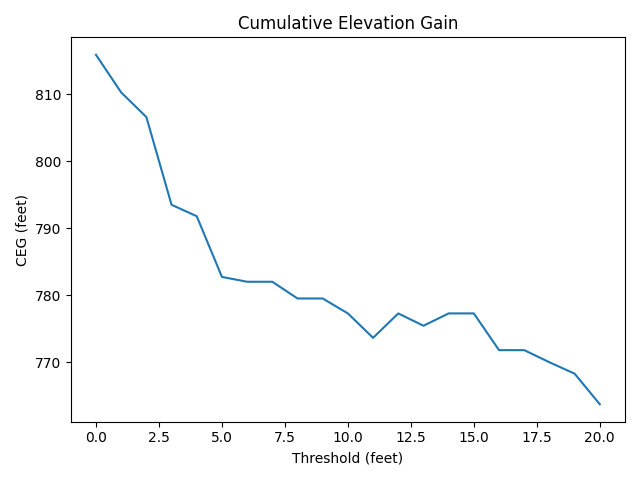
The elevation difference between the peak and the end of the hike is 790'. This is a pretty good estimate of the actual CEG of the hike.
Different hikes will give different results, and you may find it useful to look at the chart of CEG vs threshold to see how the data behaves. For a starting point, when using GPS elevation data, I recommend using a threshold of 16' (5 meters). When using barometric elevation data, I recommend starting with a threshold of 6' (2 meters).