Description
I just caught wind of a memory leak in my app and of course this is happening in production... here is what It looks like:

AKS and Application Insights both report a very close memory usage:
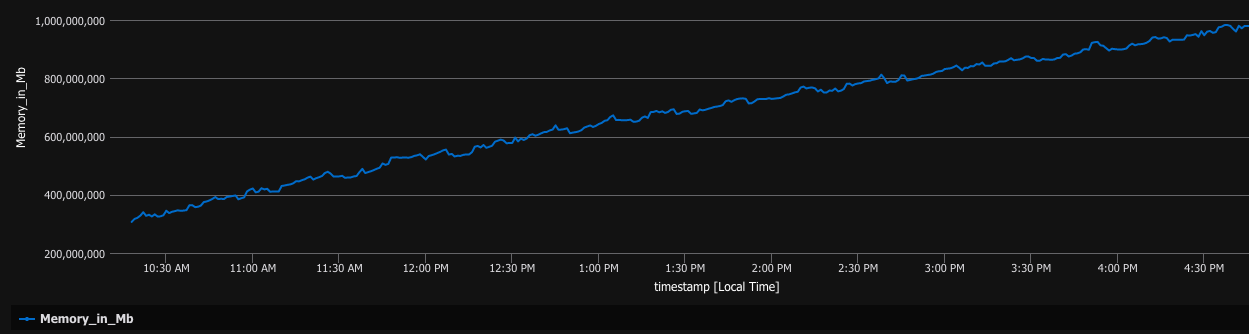
The thing is: when I got into that pod and extracted the dump, the dump only accounted for like 30mb!, take a look:
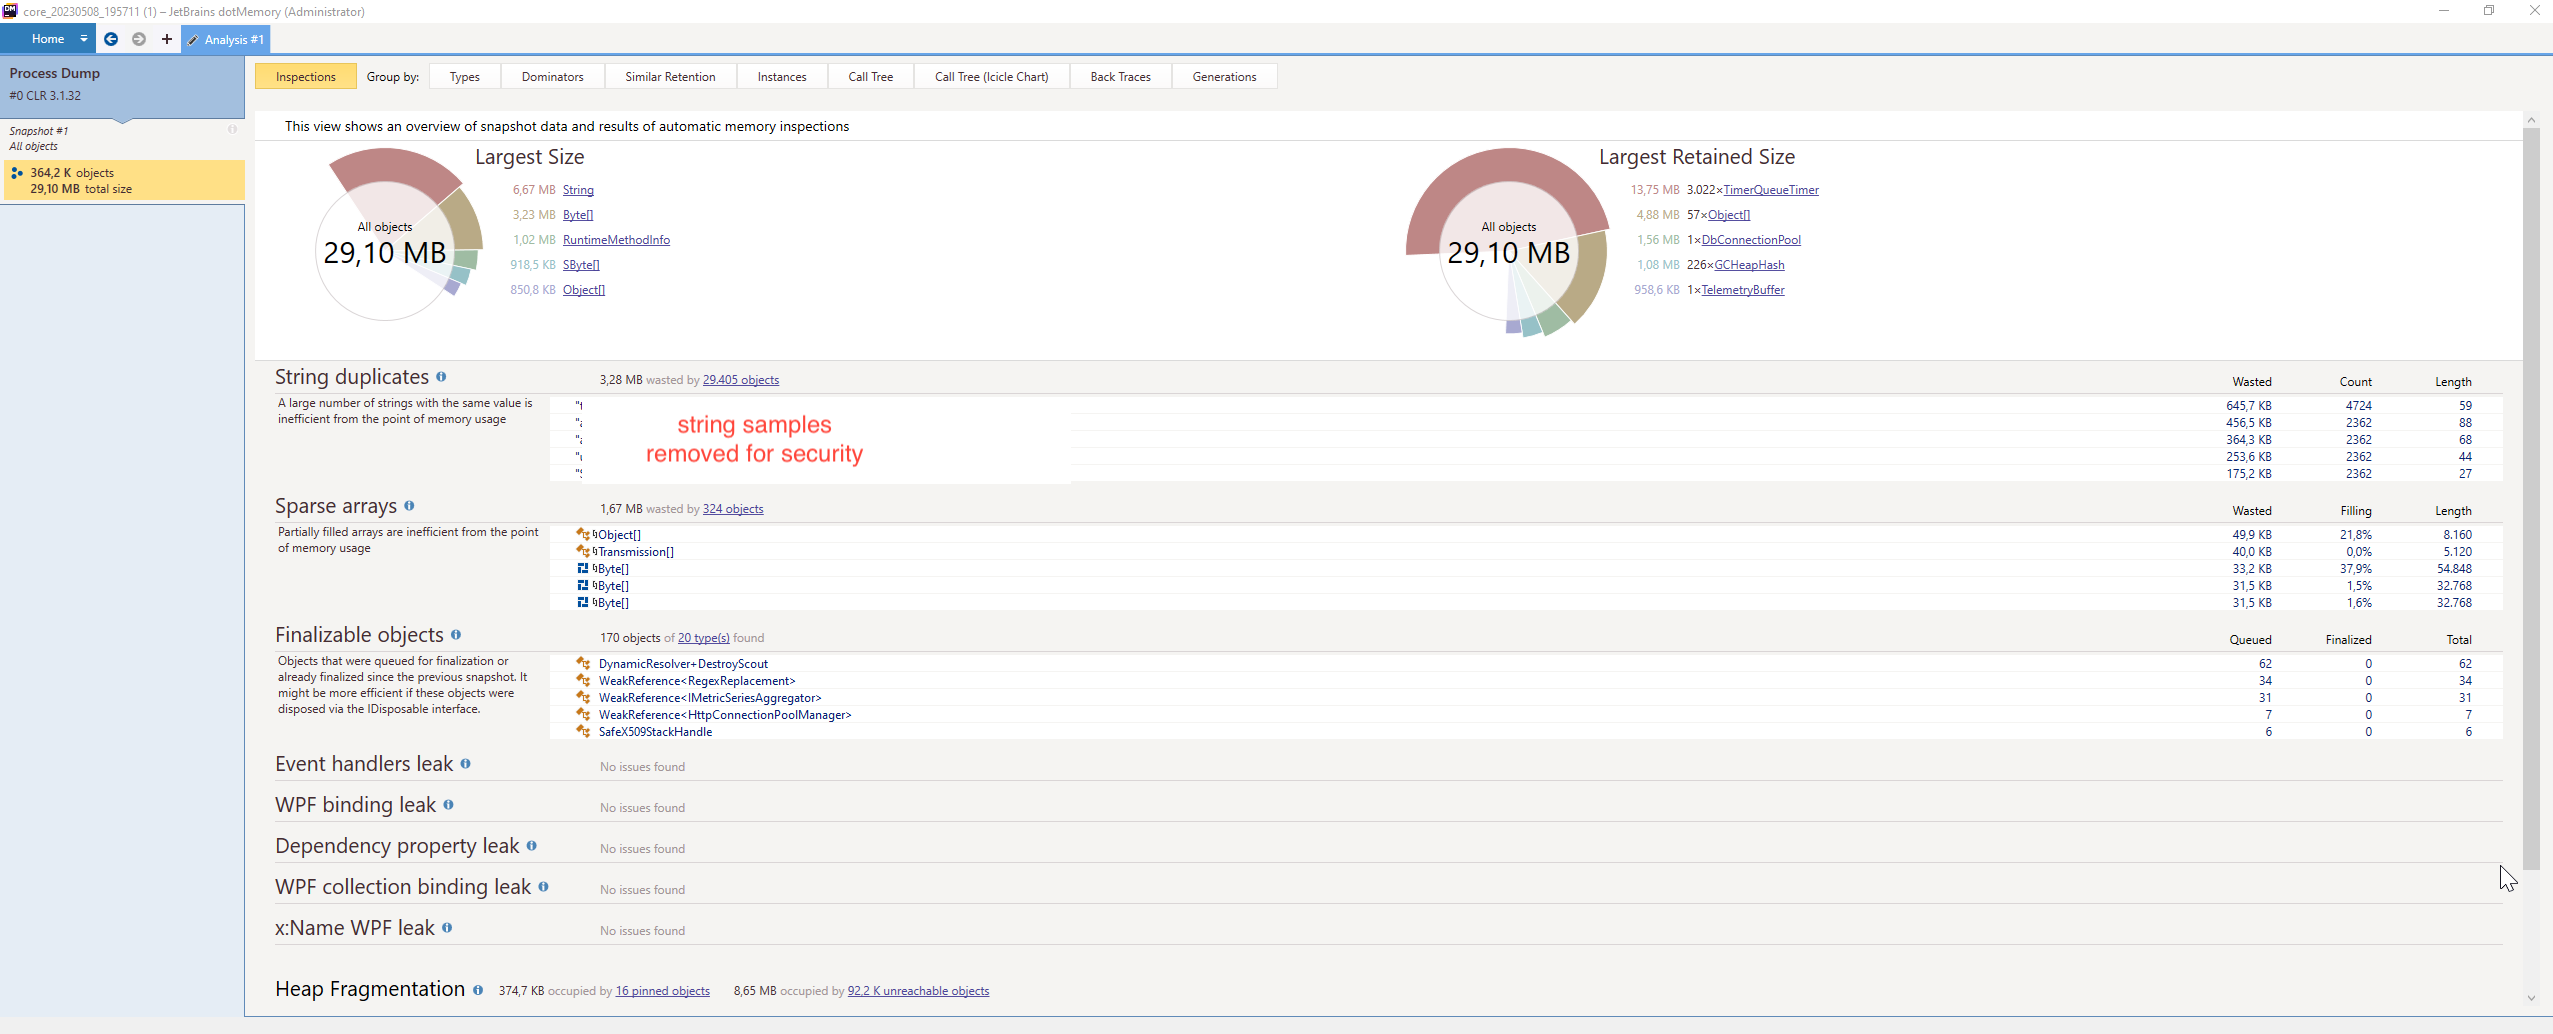
Where did the memory go? is this a bug on the dump? on the analyzer?
Configuration
.NET 7, lastest version as of today
OS is the one in the official asp.net core docker img
x64
The pod is 1GB ram and 1cpu
Regression?
Never had this problem before
Data
No extra data now, but feel free to ask!
Analysis
Might be related to #80351 ?!?
Description
I just caught wind of a memory leak in my app and of course this is happening in production... here is what It looks like:
AKS and Application Insights both report a very close memory usage:

The thing is: when I got into that pod and extracted the dump, the dump only accounted for like 30mb!, take a look:
Where did the memory go? is this a bug on the dump? on the analyzer?
Configuration
.NET 7, lastest version as of today
OS is the one in the official asp.net core docker img
x64
The pod is 1GB ram and 1cpu
Regression?
Never had this problem before
Data
No extra data now, but feel free to ask!
Analysis
Might be related to #80351 ?!?