A drop-in ASP.NET Core dashboard for ClickHouse. Add one line. Get live metrics, a table explorer, slow query analysis and visual EXPLAIN plans.


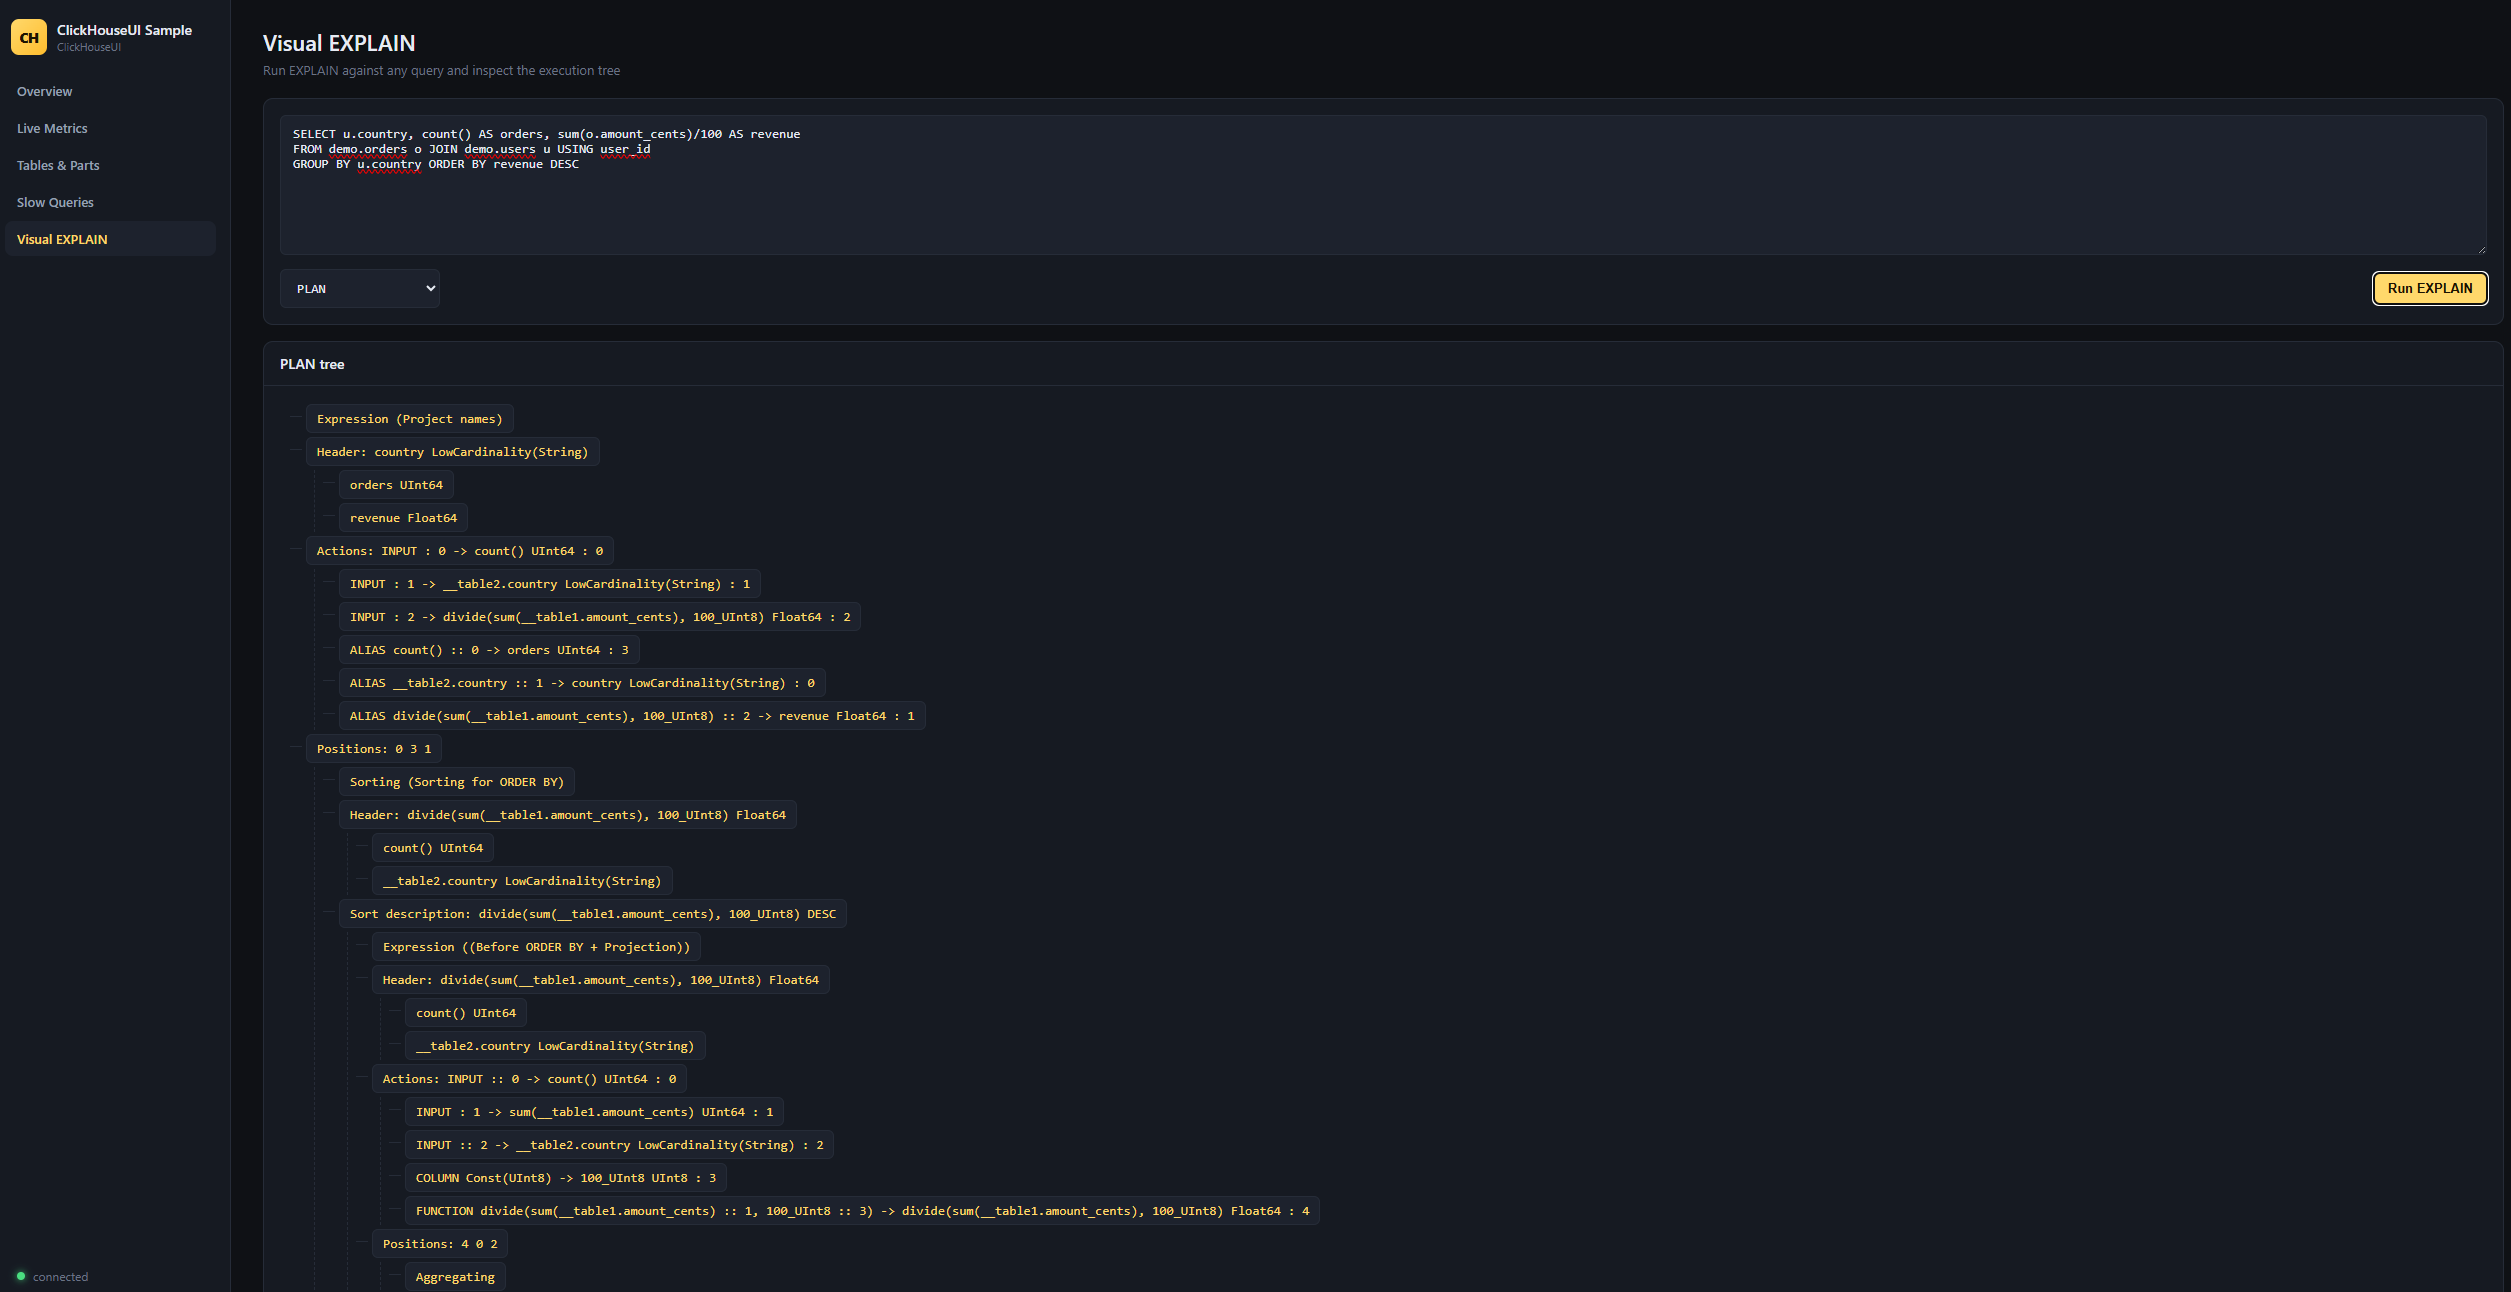
Visual EXPLAIN — paste any query and inspect the execution tree.
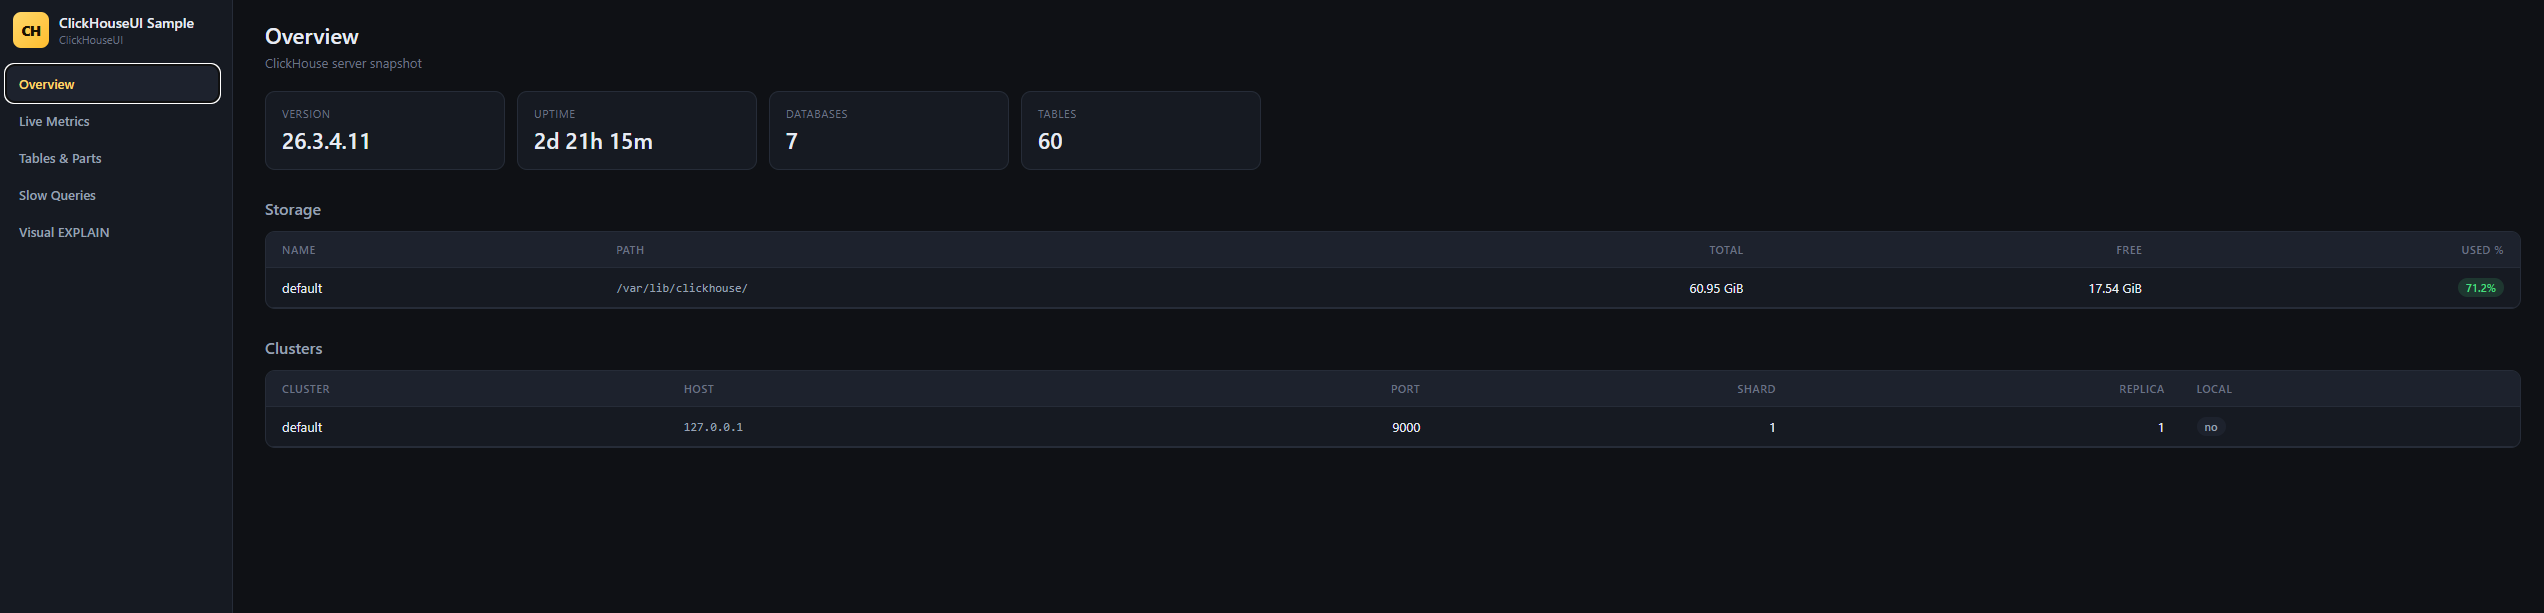
Overview — server version, uptime, disks, clusters.
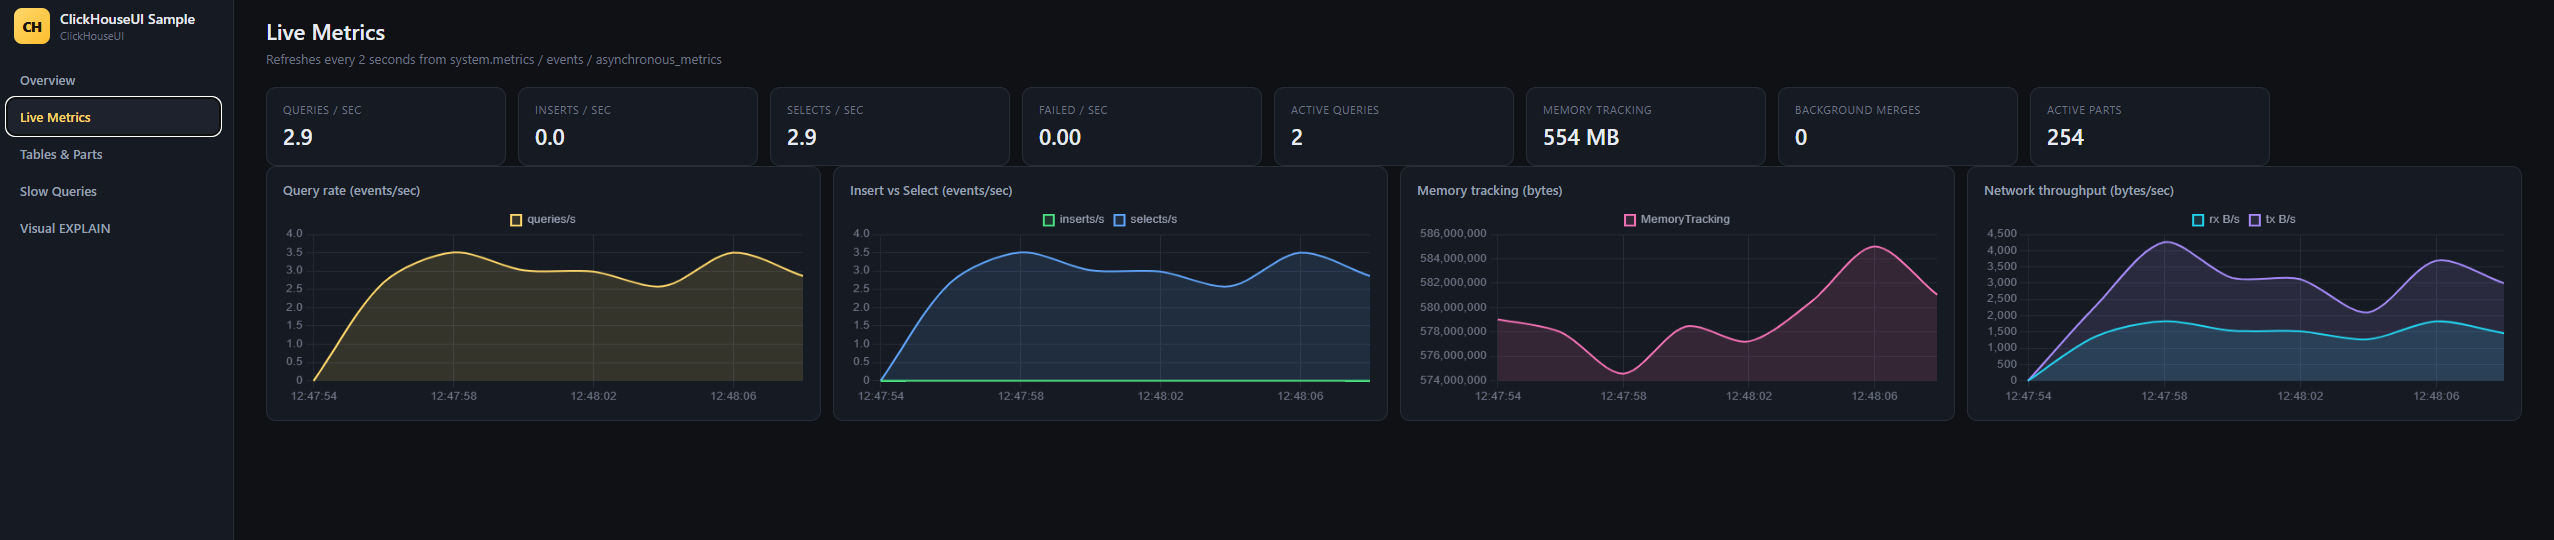
Live Metrics — 2-second polling from system.metrics / system.events.
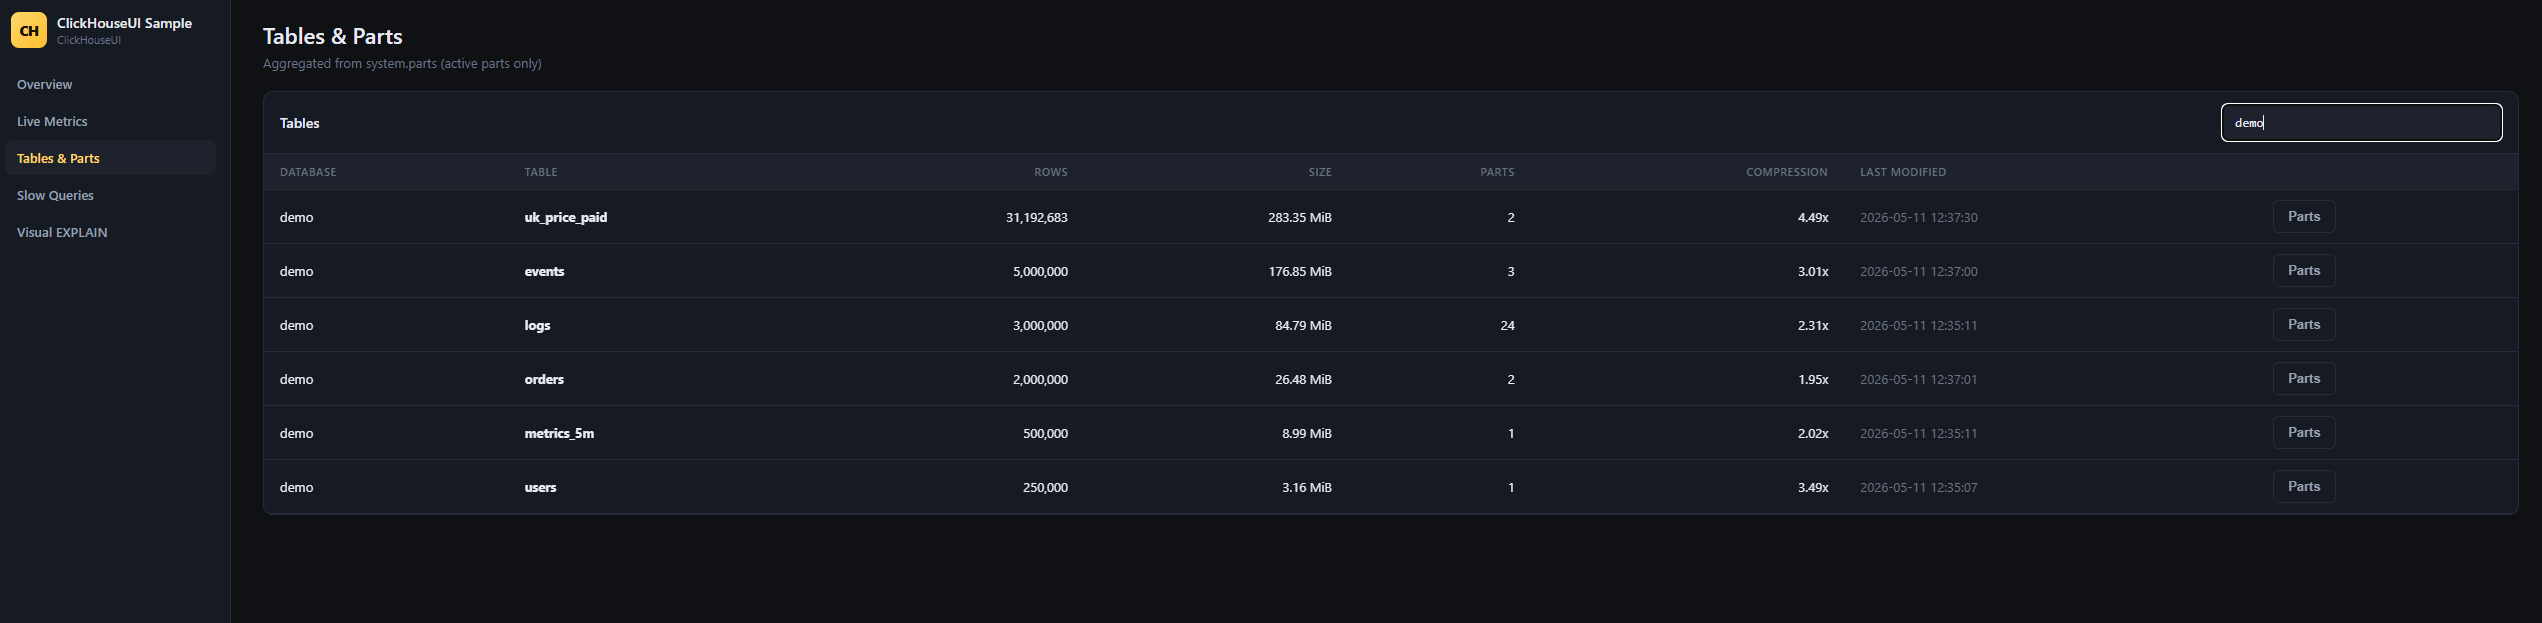
Tables & Parts — sizes, compression ratio, MergeTree parts.
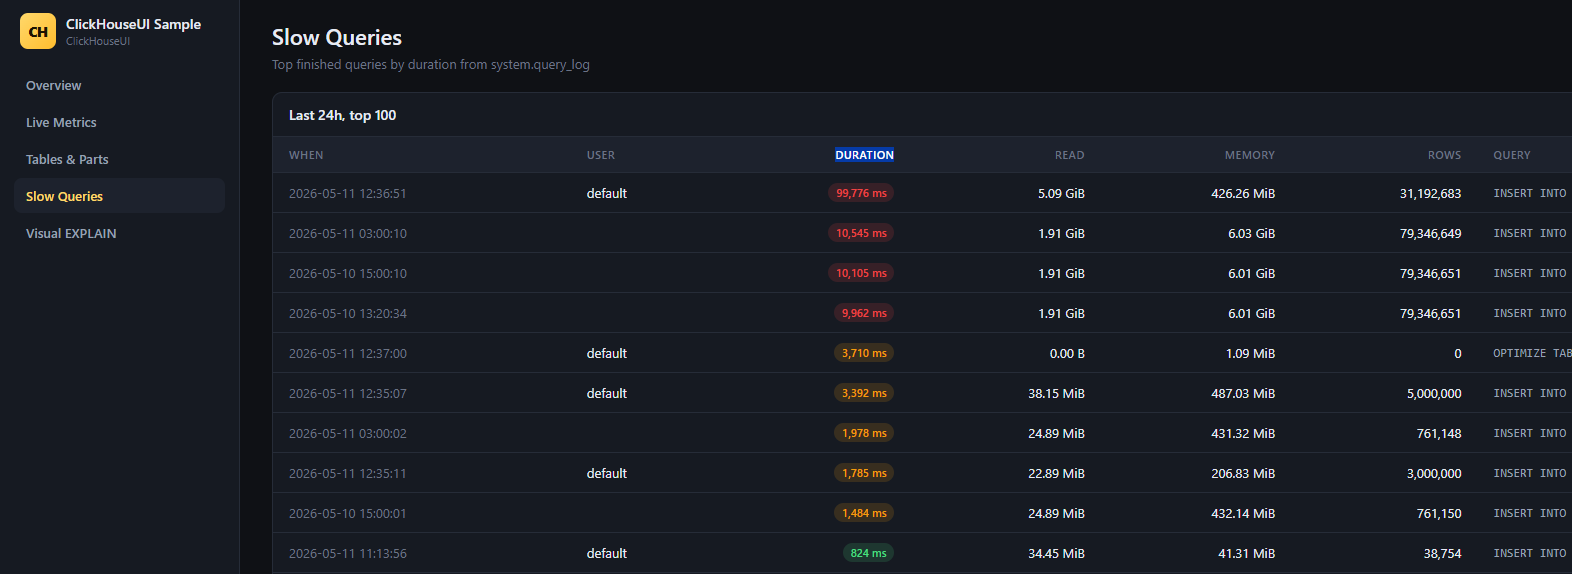
Slow Queries — top finished queries from system.query_log.
ClickHouse ships with great system tables (system.metrics, system.events, system.parts, system.query_log...). The problem: opening clickhouse-client and running SELECT * FROM system.parts WHERE active is not how you debug a production cluster at 3 AM.
ClickHouseUI is a single NuGet package that you bolt onto any ASP.NET Core app to get a Hangfire-style web dashboard. Frontend, backend and assets are all embedded in one DLL — no separate static files, no extra services, no Node.js build step.
- Overview — server version, uptime, disk usage, configured clusters
- Live Metrics — 2-second polling charts for query/insert/select rate, memory and network throughput, sourced from
system.metrics+system.events+system.asynchronous_metrics - Tables & Parts — every table sorted by disk size, with compression ratio and part count, plus a one-click drill-down into individual MergeTree parts
- Slow Queries — top finished queries from
system.query_login the last N hours, with duration, memory and bytes read - Visual EXPLAIN — paste any query, choose
PLAN/PIPELINE/INDEXES/SYNTAX, see the execution tree rendered interactively (raw output included for the brave)
dotnet add package ClickHouseUIusing ClickHouseUI;
var builder = WebApplication.CreateBuilder(args);
var app = builder.Build();
app.UseClickHouseDashboard("Host=localhost;Port=8123;User=default;Database=default");
app.Run();Navigate to http://localhost:5000/clickhouse and you're in.
app.UseClickHouseDashboard("/admin/clickhouse", options =>
{
    options.ConnectionString      = builder.Configuration.GetConnectionString("ClickHouse")!;
    options.Title                 = "Production Cluster — EU West";
    options.SlowQueriesLimit      = 200;
    options.QueryLogLookbackHours = 6;
    options.AllowAnonymous        = false;
    options.Authorize             = ctx => ctx.User.IsInRole("DBA");
});| Option | Default | Description |
|---|---|---|
ConnectionString |
Host=localhost;Port=8123;User=default;Database=default |
ADO.NET connection string consumed by ClickHouse.Client. |
Title |
ClickHouse Dashboard |
Header label — useful when you mount dashboards against multiple environments. |
SlowQueriesLimit |
100 |
Max rows returned by the slow-queries view (1–1000). |
QueryLogLookbackHours |
24 |
How far back to scan system.query_log (1–720). |
AllowAnonymous |
true |
When false, every request runs through Authorize. |
Authorize |
null |
Func<HttpContext, bool> predicate. Return false to reject. |
The dashboard talks to ClickHouse with the credentials in your connection string and surfaces system tables to anyone who can reach the mount path. Always put it behind your existing auth middleware (or set AllowAnonymous = false and supply an Authorize predicate) in production.
Recommended setup:
app.UseAuthentication();
app.UseAuthorization();

app.MapWhen(ctx => ctx.User.Identity?.IsAuthenticated == true, branch =>
{
    branch.UseClickHouseDashboard(connectionString);
});- Single ASP.NET Core middleware mounted at a configurable path.
- All static assets (HTML, CSS, JS, Chart.js) are embedded into the assembly with
<EmbeddedResource>and served by the middleware itself —UseStaticFilesis not required. - Backend is plain Minimal-style endpoints inside the middleware; each tab maps to one JSON endpoint under
/<base>/api/*. - ClickHouse access goes through
ClickHouse.Client(ADO.NET), so authentication, TLS and compression options from its connection string all work out of the box. - Frontend is a tiny hash-router SPA with no build step — easy to fork, easy to audit.
- .NET 8.0 or later
- ClickHouse 22.3+ (anything with
system.query_log,system.parts,system.asynchronous_metrics) - The configured ClickHouse user needs
SELECTon thesystemdatabase
The Community Edition is intentionally read-only and free forever. Planned Pro features:
- Query Killer — cancel a runaway query straight from the UI
- Schema Migrations — create/alter tables visually
- Alerting — Slack/Email when disk passes 90 %, replication lag, dead replicas, etc.
- Multi-cluster — mount one dashboard against many ClickHouse hosts
- Query Profiler — flame graph from
system.trace_log - Replication Topology — visualise ZooKeeper / Keeper state
Open an issue if there's something you want next.
PRs welcome. Quick start:
git clone https://github.com/erkerkan/clickhouse-ui
cd clickhouse-ui
dotnet build
dotnet run --project samples/ClickHouseUI.Sample
Then open http://localhost:5188/clickhouse. The sample app reads the connection string from samples/ClickHouseUI.Sample/appsettings.json.
MIT © Murat Erkara