I launched my app in profile mode in Android Studio by clicking on the toolbar profile icon. In the Flutter performance side pane I was able to see the frame times and there was a link to open the DevTool. I clicked on the DevTool link, it launched the DevTool in my default browser (chrome) window, from there I clicked on the Performance tab to view the frames chart but it was empty (the timelines chart was fulfilled). The app's performance overlay shows the raster chart as it should.
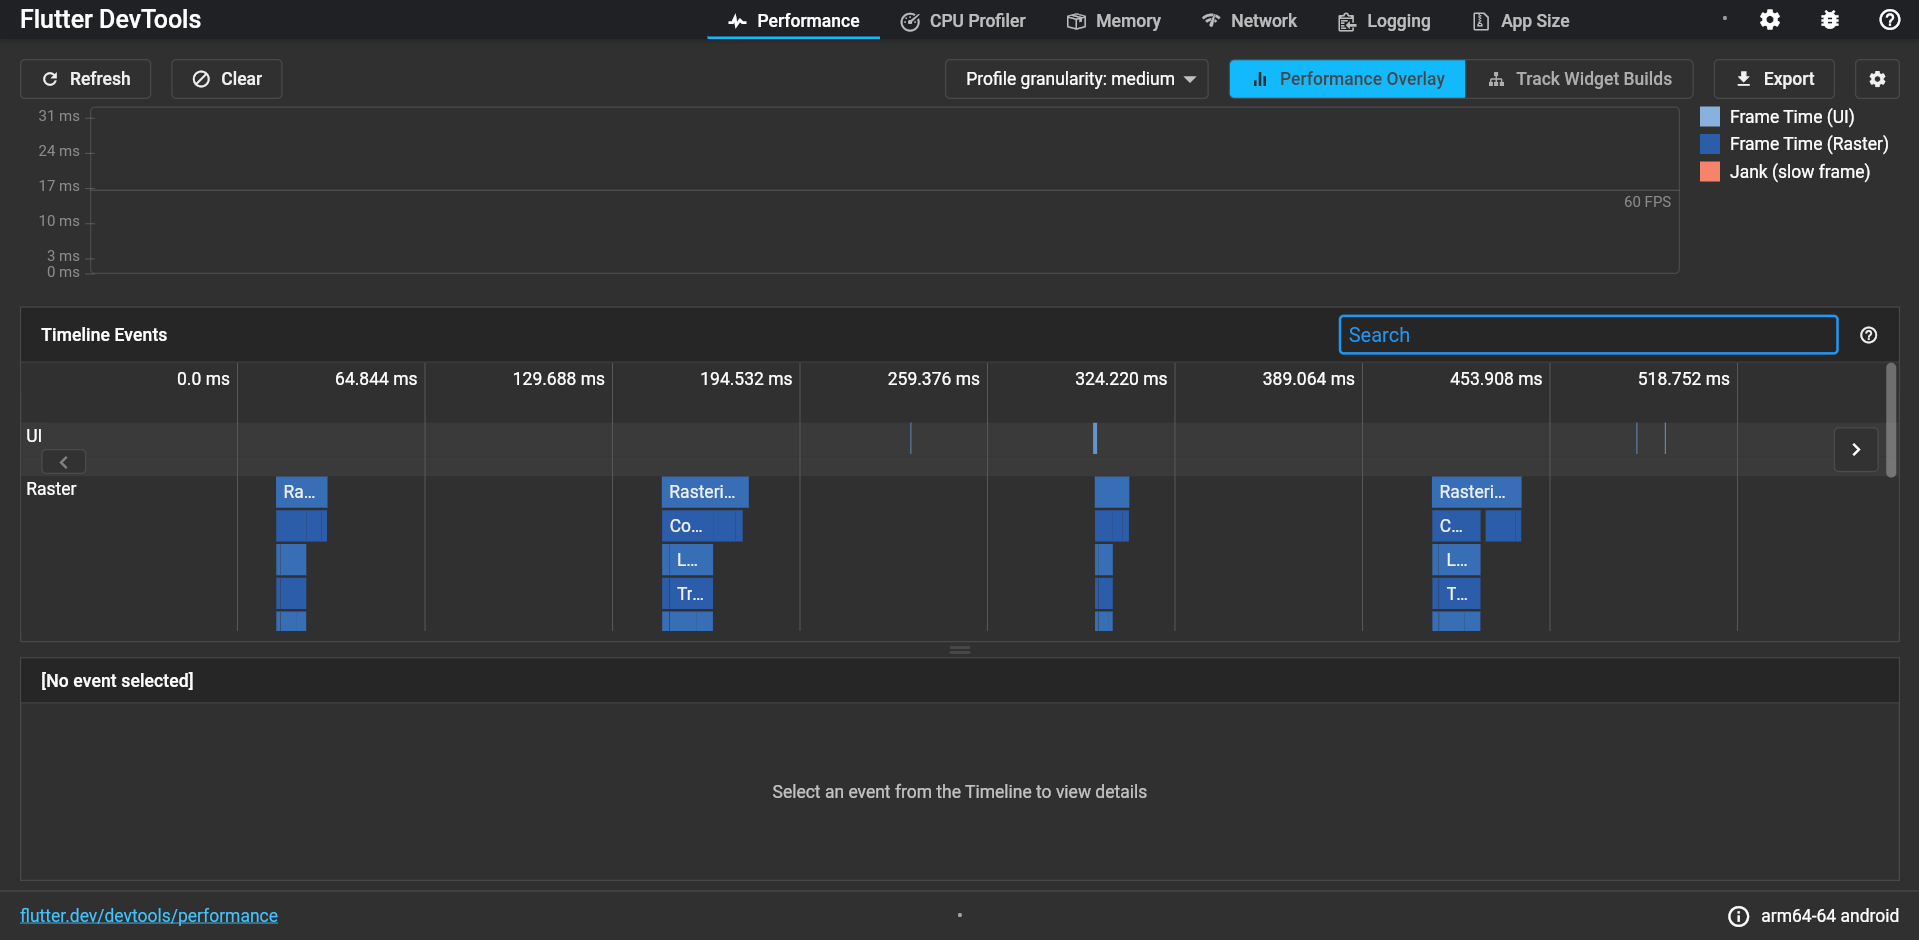
This problem only happens in profile mode. In debug mode I always have this chart filled
Tested on
DevTools version: 2.5.0
Android Studio version: 4.2.2
Below is the output generated by the flutter doctor -v command
[√] Flutter (Channel stable, 2.2.3, on Microsoft Windows [versão 10.0.19043.1165], locale pt-BR)
• Flutter version 2.2.3 at C:\Users\fosan\Documents\flutter
• Framework revision f4abaa0735 (7 weeks ago), 2021-07-01 12:46:11 -0700
• Engine revision 241c87ad80
• Dart version 2.13.4
[√] Android toolchain - develop for Android devices (Android SDK version 30.0.3)
• Android SDK at C:\Users\fosan\AppData\Local\Android\Sdk
• Platform android-30, build-tools 30.0.3
• Java binary at: C:\Program Files\Android\Android Studio\jre\bin\java
• Java version OpenJDK Runtime Environment (build 11.0.8+10-b944.6842174)
• All Android licenses accepted.
[√] Chrome - develop for the web
• Chrome at C:\Program Files\Google\Chrome\Application\chrome.exe
[√] Android Studio
• Android Studio at C:\Program Files\Android\Android Studio
• Flutter plugin can be installed from:
https://plugins.jetbrains.com/plugin/9212-flutter
• Dart plugin can be installed from:
https://plugins.jetbrains.com/plugin/6351-dart
• android-studio-dir = C:\Program Files\Android\Android Studio
• Java version OpenJDK Runtime Environment (build 11.0.8+10-b944.6842174)
[√] VS Code (version 1.59.0)
• VS Code at C:\Users\fosan\AppData\Local\Programs\Microsoft VS Code
• Flutter extension version 3.25.0
[√] Connected device (3 available)
• ASUS X00QD (mobile) • 192.168.1.176:5555 • android-arm64 • Android 11 (API 30)
• Chrome (web) • chrome • web-javascript • Google Chrome 92.0.4515.131
• Edge (web) • edge • web-javascript • Microsoft Edge 92.0.902.73
• No issues found!

I launched my app in profile mode in Android Studio by clicking on the toolbar profile icon. In the Flutter performance side pane I was able to see the frame times and there was a link to open the DevTool. I clicked on the DevTool link, it launched the DevTool in my default browser (chrome) window, from there I clicked on the Performance tab to view the frames chart but it was empty (the timelines chart was fulfilled). The app's performance overlay shows the raster chart as it should.
This problem only happens in profile mode. In debug mode I always have this chart filled
Tested on
DevTools version: 2.5.0
Android Studio version: 4.2.2
Below is the output generated by the flutter doctor -v command
[√] Flutter (Channel stable, 2.2.3, on Microsoft Windows [versão 10.0.19043.1165], locale pt-BR)
• Flutter version 2.2.3 at C:\Users\fosan\Documents\flutter
• Framework revision f4abaa0735 (7 weeks ago), 2021-07-01 12:46:11 -0700
• Engine revision 241c87ad80
• Dart version 2.13.4
[√] Android toolchain - develop for Android devices (Android SDK version 30.0.3)
• Android SDK at C:\Users\fosan\AppData\Local\Android\Sdk
• Platform android-30, build-tools 30.0.3
• Java binary at: C:\Program Files\Android\Android Studio\jre\bin\java
• Java version OpenJDK Runtime Environment (build 11.0.8+10-b944.6842174)
• All Android licenses accepted.
[√] Chrome - develop for the web
• Chrome at C:\Program Files\Google\Chrome\Application\chrome.exe
[√] Android Studio
• Android Studio at C:\Program Files\Android\Android Studio
• Flutter plugin can be installed from:
https://plugins.jetbrains.com/plugin/9212-flutter
• Dart plugin can be installed from:
https://plugins.jetbrains.com/plugin/6351-dart
• android-studio-dir = C:\Program Files\Android\Android Studio
• Java version OpenJDK Runtime Environment (build 11.0.8+10-b944.6842174)
[√] VS Code (version 1.59.0)
• VS Code at C:\Users\fosan\AppData\Local\Programs\Microsoft VS Code
• Flutter extension version 3.25.0
[√] Connected device (3 available)
• ASUS X00QD (mobile) • 192.168.1.176:5555 • android-arm64 • Android 11 (API 30)
• Chrome (web) • chrome • web-javascript • Google Chrome 92.0.4515.131
• Edge (web) • edge • web-javascript • Microsoft Edge 92.0.902.73
• No issues found!