Allow disable report timing in profile build since it takes not-negligible amount of time#113526
Allow disable report timing in profile build since it takes not-negligible amount of time#113526fzyzcjy wants to merge 4 commits intoflutter:masterfrom
Conversation
 goderbauer
left a comment
goderbauer
left a comment
There was a problem hiding this comment.
I find adding this a bit dubios. The environment flag will be really hard to discover. Also, profile mode exists so you can get these kind of performance metrics out of your app. If you don't want that, there's always release mode...
| /// Whether to send frame events to DevTool | ||
| static bool get _enableProfileFrame { | ||
| bool? override; | ||
| assert(() { | ||
| override = debugOverrideEnableProfileFrame; | ||
| return true; | ||
| }()); | ||
| return override ?? const bool.fromEnvironment('FLUTTER_PROFILE_FRAME', defaultValue: true); | ||
| } |
There was a problem hiding this comment.
This really has no impact in release mode? How did you verify that?
There was a problem hiding this comment.
There was a problem hiding this comment.
I can remove the environment variable, see below.
| mixin SchedulerBinding on BindingBase { | ||
| /// Override [_enableProfileFrame] in debug mode. | ||
| @visibleForTesting | ||
| static bool? debugOverrideEnableProfileFrame; |
There was a problem hiding this comment.
I don't think we should be exposing this and its also not super-helpful for testing. The test now only checks that this flag works which only exists for the test. It doesn't really test whether the actual env variable is doing the right thing...
There was a problem hiding this comment.
So may I know how Flutter tests existing env variable? Then I can make something similar
There was a problem hiding this comment.
I can remove the environment variable, see below.
|
Without this, how do you measure frame timings in profile mode? |
I personally by the timeline data. You know, look at the GPURasterizer::Draw rectangle inside timeline, etc. p.s. partially related flutter/devtools#4522 |
Hmm why are other env flags in flutter easy to discover, by adding doc or something else? I can do the same, then this is no problem.
As mentioned above, these perf metrics are already exposed via the timeline data, such as by looking at GPURasterizer::Draw.
But we need to do profiling to get profile data, don't we :) |
|
Rephrase the problem: We are providing redundant data (i.e. report timing, even if timeline tracing already has the data), and that redundancy is causing measurable speed drop compared with release mode. Then we are biasing the profiling result. So, if this is not to be merged, maybe we should create another PR to the doc site, with something like: "Please do not believe the speed in profile mode. It will be measureably slower than release mode." But IMHO users will not like that sentence. |
|
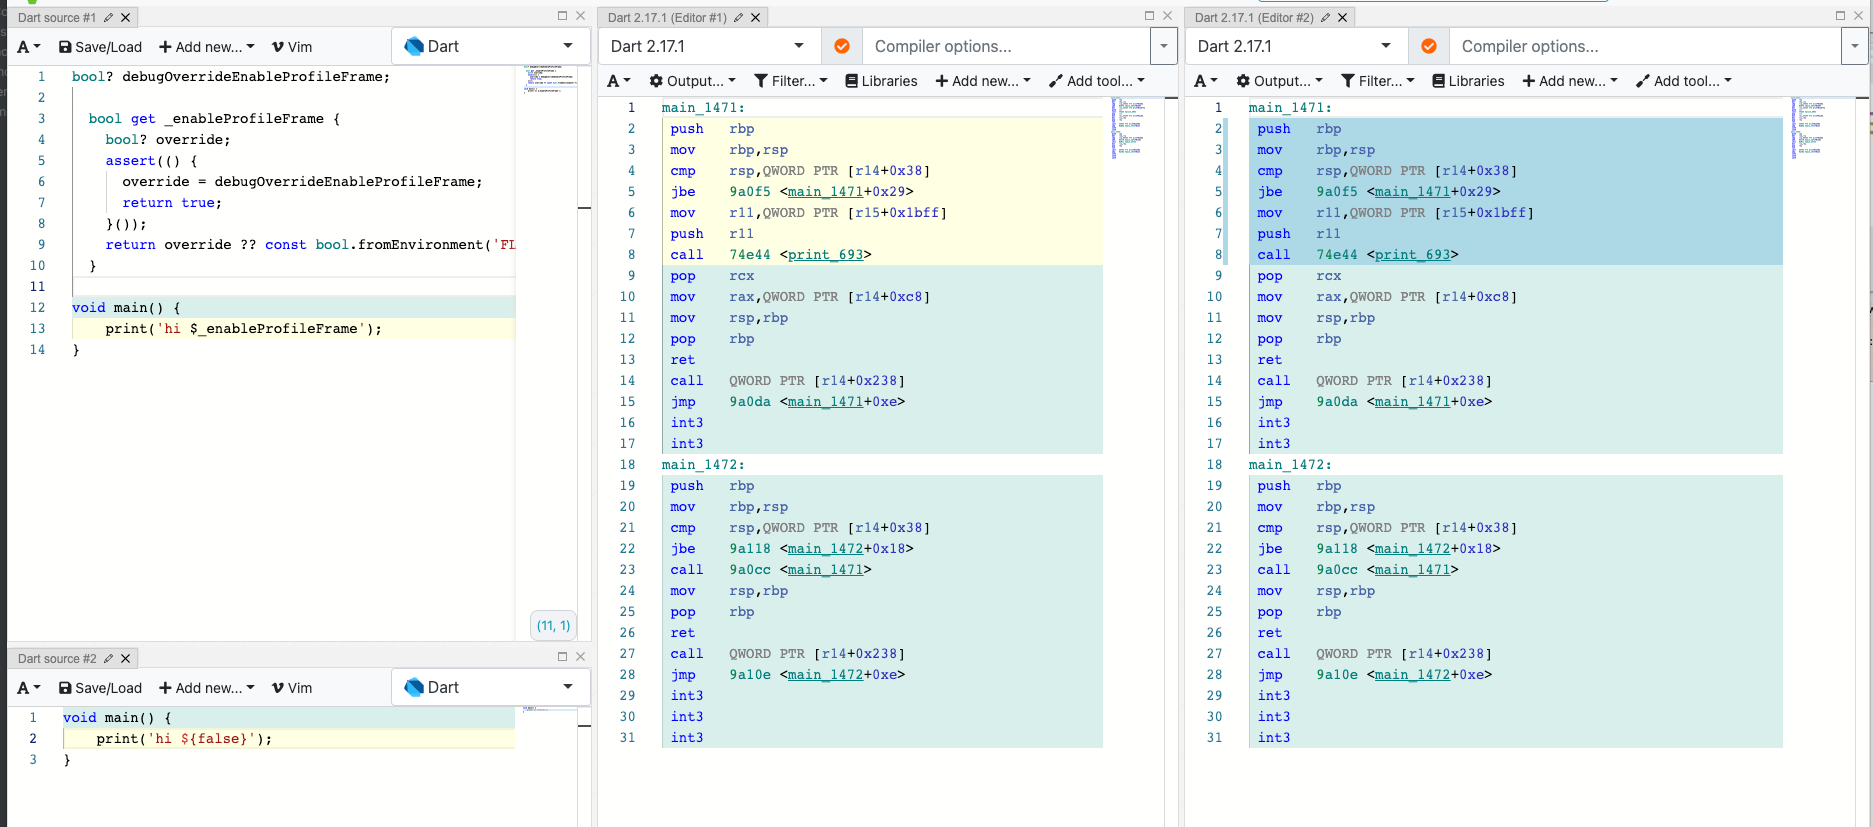
Look like I can remove the environment variable. In Dart, if we have a normal variable that only has one constant value, then the field will be removed. dart-lang/sdk#50287 (comment) "Also AOT compiler is capable of removing unused fields of various kinds (the field is also effectively unused if it always contains the same constant value or is only written into, but never read)." The experiment confirms this: https://godbolt.org/z/Thd91YcPj
I will update the code shortly. |

84357fc to
d610158
Compare
This method is significantly cheaper than the timeline. |
I originally thought so. But interestingly, seems no in a few reasons:
For disable tracing: Not see any flag to disable IMHO |
|
It'd be really helpful if you could share some measurements (including device/platform/runtime mode). |
|
@dnfield Let me find an old screenshot from my past experiment (https://github.com/fzyzcjy/yplusplus/issues/6124#issuecomment-1272830057)
after fix
|


|
You can use systracing instead of timeline by doing Unfortunately, I'm having trouble from the images telling where the extra time is being spent. I'm also confused why the traces are looking at pointer data packet events when this bug is about frame timings. I think we should try to look at ways to make the frame timings measurements cheaper on representative hardware rather than disabling them. Timeline adds more overhead on every frame. Maybe you could file an issue with some of your findings? |
Ah sorry! I must paste the wrong image here - at the time I wrote the reply I may be thinking about my another PR about pointer events.
Sure. I will do that soon (have no time now so possibly within a few days) |
|
As discussed earlier in Discord, maybe I will focus on the main part of flutter_smooth now (quite busy recently), and restart this PR after the critical PRs of flutter_smooth has been merged. (For future readers of this thread: Recent progress of the critical PRs are not only in flutter repositories and discord, but also somewhere such as fzyzcjy/flutter_smooth#173) |
Flutter does say the time cost is "less than 0.1ms every 1 second to report the timings measured on iPhone6S". However, not every mobile phone is as high-end as iPhone6S. For example, on my testing device (TRT-AL00, indeed not the lowest-end device!), I measured that it takes about 20-30ms per second. Then we have a problem. When having https://github.com/fzyzcjy/flutter_smooth, we know a big janky frame (say, takes 200ms) will never let user really feel janky, but instead user will see the app being 60FPS smooth. However, this is based on the assumption that misc work such as report timings should not block the UI thread for a continuous period of time - which is not true if report timings happens. After the 200ms janky frame, we see about 6ms of report timing. Among with other things such as dispatch touch events, they easily take up more than ~16ms and we get one jank. Then flutter_smooth is no longer smooth due to the jank.
Except for the case of flutter_smooth, IMHO this PR is also useful for normal Flutter users. It takes 2-3% of CPU time, which is not negligible and may be measured. In addition, this is not a critical feature. Surely, when this is disabled, the DevTool will not show the frame ui/rasterizer time at all. However, not everyone needs to read that timing data, since they may either do not open DevTool, or use the tracing timeline instead (which contains more than enough information to know the frame timing data). Therefore, it looks reasonable to at least give users a chance (i.e. a flag) to disable it.
The code is deliberately written by reading a const bool environment variable. Therefore, it has completely zero overhead. I have confirmed that by using compiler explorer before - https://discordapp.com/channels/608014603317936148/608021234516754444/1024141682377236500.
Pre-launch Checklist
///).If you need help, consider asking for advice on the #hackers-new channel on Discord.