D3: Scatterplot Example fails tests #34259
Description
Describe the bug
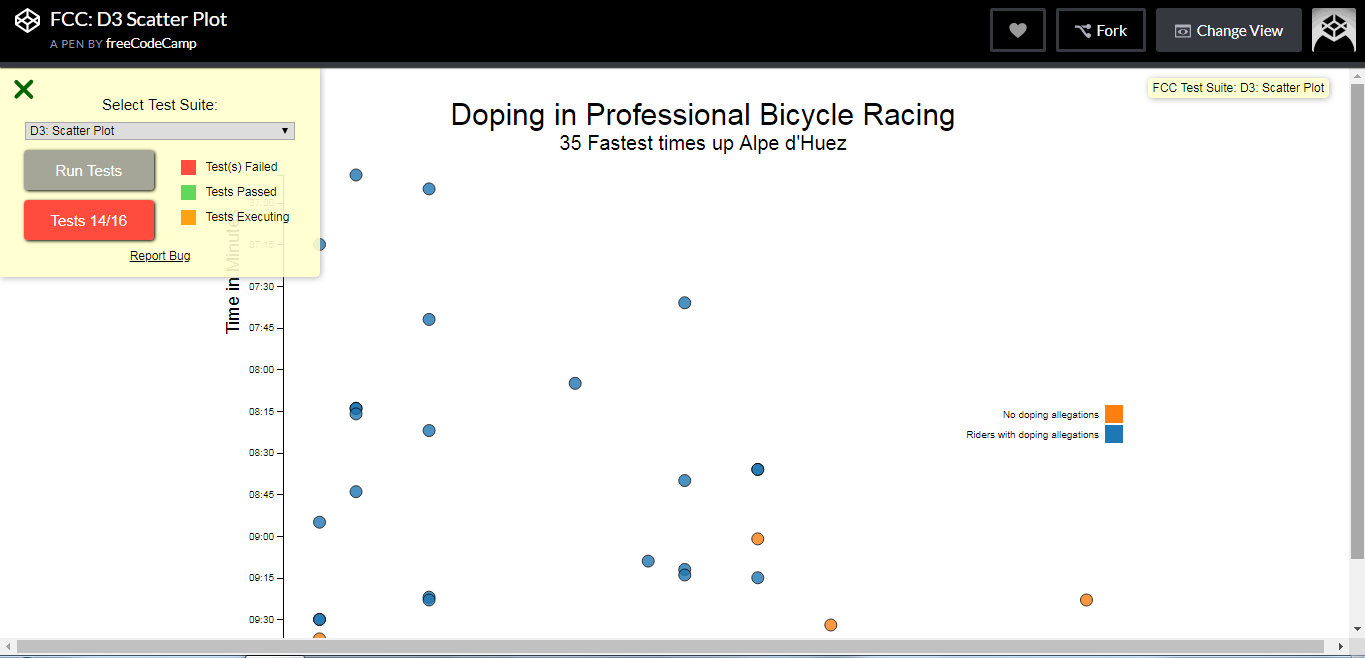
The example given for the D3 scatter plot challenge on CodePen is failing certain tests which it should not have. Only 14 out of the required 16 tests are passing.
The failing tests are namely:
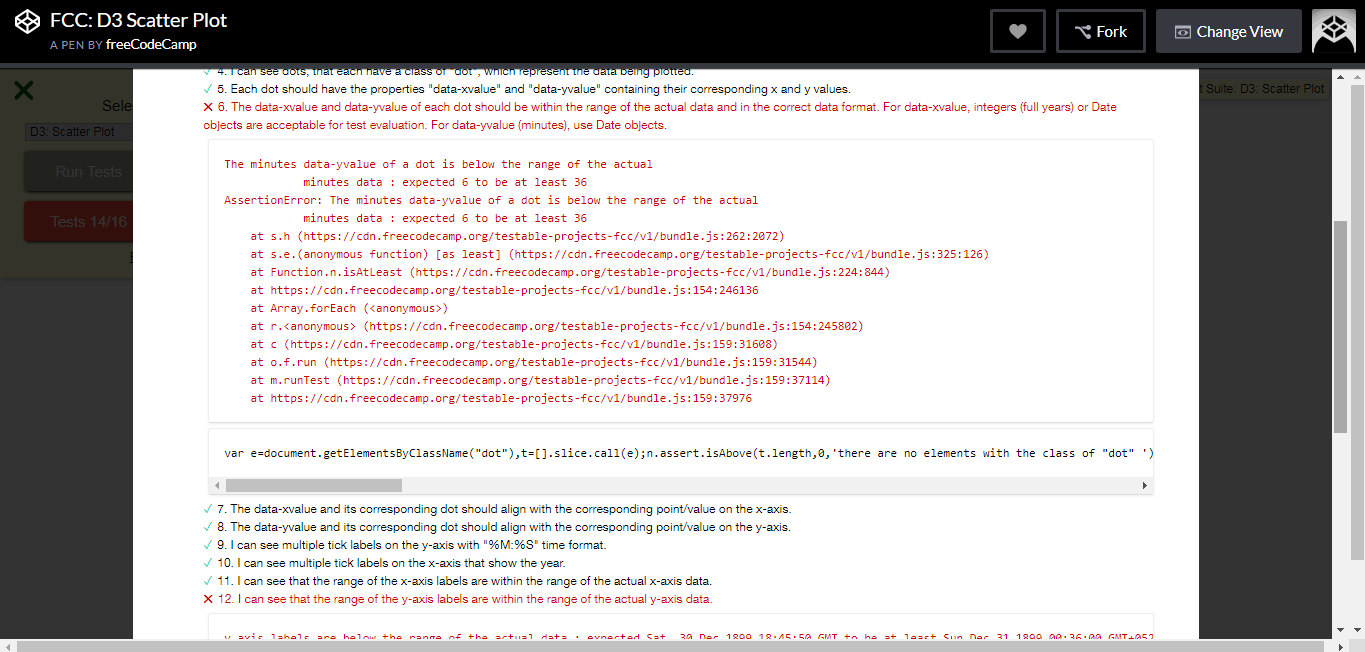
6. The data-xvalue and data-yvalue of each dot should be within the range of the actual data and in the correct data format. For data-xvalue, integers (full years) or Date objects are acceptable for test evaluation. For data-yvalue (minutes), use Date objects.
and
12. I can see that the range of the y-axis labels are within the range of the actual y-axis data.
To Reproduce
Steps to reproduce the behavior:
- Go to 'https://codepen.io/freeCodeCamp/full/bgpXyK'
- Click on 'Run Tests'
- Wait till the tests are completed
- See that only 14 out of 16 tests are passing.
Expected behavior
Since it is an example for the campers to follow, they should be shown something in which all tests pass
Screenshots
If applicable, add screenshots to help explain your problem.
Desktop (please complete the following information):
- Windows 7 x32
- Google Chrome
- Version 70.0.3538.77 (Official Build) (32-bit)