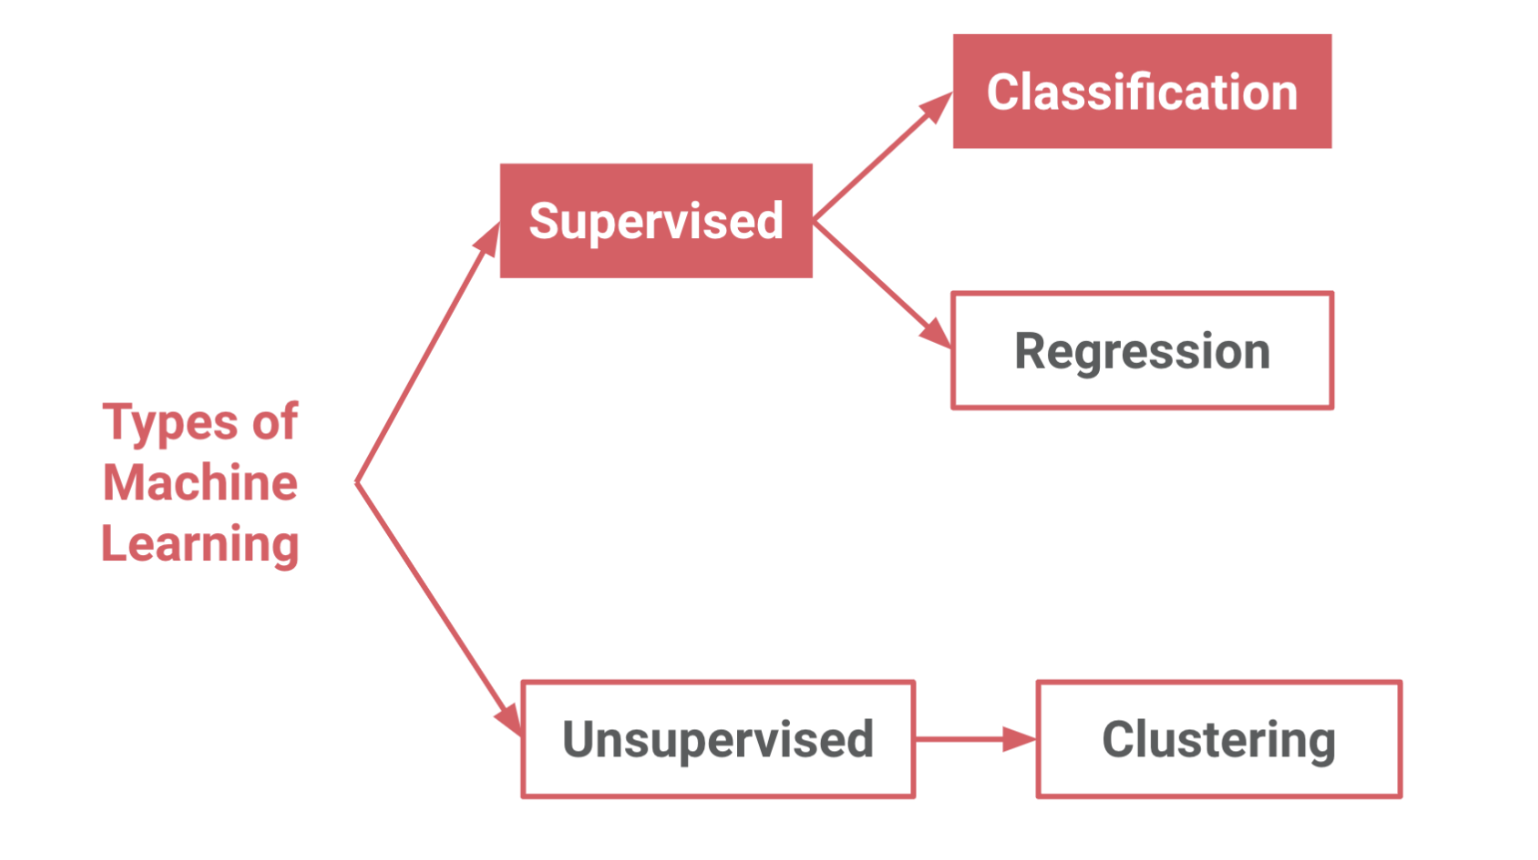
Supervised learning is a subcategory of machine learning and artificial intelligence.
It is defined by its use of labeled datasets to train algorithms that to classify data or predict outcomes accurately.
Whatever we want to predict is called as Dependent Variable, while variables that we use to predict are called as Independent Variables.
📌 Supervised learning can be separated into two types:
-
Classification uses an algorithm to accurately assign test data into specific categories. It recognizes specific entities within the dataset and attempts to draw some conclusions on how those entities should be labeled or defined. Common classification algorithms are linear classifiers, support vector machines (SVM), decision trees, k-nearest neighbor, and random forest.
-
Regression is used to understand the relationship between dependent and independent variables. It is commonly used to make projections, such as for sales revenue for a given business. Linear regression, logistical regression, and polynomial regression are popular regression algorithms.
📌 Metrics to Evaluate your Supervised Machine Learning Algorithm:
-
Accuracy score : is calculated by dividing the number of correct predictions by the total prediction number.
There is a general rule when it comes to understanding accuracy scores: Over 90% - Very good. Between 70% and 90% - Good. Between 60% and 70% - OK.
-
ROC AUC Score: tells us how efficient the model is. AUC stands for "Area under the ROC Curve". The higher the AUC, the better the performance of the model at distinguishing between the positive and negative classes.
-
MAE (Mean Absolute Error) : is the average of the difference between the Original Values and the Predicted Values. It gives us the measure of how far the predictions were from the actual output.
-
MSE (Mean Squared Error) : is quite similar to Mean Absolute Error, the only difference being that MSE takes the average of the square of the difference between the original values and the predicted values. The advantage of MSE being that it is easier to compute the gradient, whereas Mean Absolute Error requires complicated linear programming tools to compute the gradient.
-
R2 Score : is a very important metric that is used to evaluate the performance of a regression-based machine learning model. It is pronounced as R squared and is also known as the coefficient of determination. It works by measuring the amount of variance in the predictions explained by the dataset.
-
Confusion Matrix: as the name suggests gives us a matrix as output and describes the complete performance of the model.
True Positives : The cases in which we predicted YES and the actual output was also YES.
True Negatives : The cases in which we predicted NO and the actual output was NO.
False Positives : The cases in which we predicted YES and the actual output was NO.
False Negatives : The cases in which we predicted NO and the actual output was YES.
