Manual
The program gffcompare can be used to compare, merge, annotate and estimate accuracy of one or more GFF files (the “query” files), when compared with a reference annotation (also provided as GFF).
Usage:
gffcompare [options]* {-i <input_gtf_list> | <input1.gtf> [<input2.gtf> .. <inputN.gtf>]}
-i |
provide a text file with a list of (query) GTF files to process instead of expecting them as command-line arguments (useful when a large number of GTF files should be processed). |
-h/-help |
Prints the help message and exits |
-v/--version |
Prints the version number and exits |
-o <outprefix> |
All output files created by gffcompare will have this prefix (e.g. .loci, .tracking, etc.). If this option is not provided the default output prefix being used is: “gffcmp” |
-r |
An optional “reference” annotation GFF file. Each sample is matched against this file, and sample isoforms are tagged as overlapping, matching, or novel where appropriate. See the .refmap and .tmap output file descriptions below. |
-R |
If -r was specified, this option causes gffcompare to ignore reference transcripts that are not overlapped by any transcript in one of input1.gtf,…,inputN.gtf. Useful for ignoring annotated transcripts that are not present in your RNA-Seq samples and thus adjusting the “sensitivity” calculation in the accuracy report written in the file. |
-Q |
If -r was specified, this option causes gffcompare to ignore input transcripts that are not overlapped by any transcript in the reference. Useful for adjusting the “precision” calculation in the accuracy report written in the file. |
-M |
discard (ignore) single-exon transfrags and reference transcripts (i.e. consider only multi-exon transcripts) |
-N |
discard (ignore) single-exon reference transcripts; single-exon transfrags are still considered, but they will never find an exact match |
-D |
discard "duplicate" (redundant) query transfrags (i.e. those with the same intron chain) within a single sample (and thus disable "annotation" mode) |
-s <genome_path> |
path to genome sequences (optional); this will enable the "repeat" ('r') classcode assessment; <genome_path> should be a full path to a multi-FASTA file, preferrably indexed with samtools faidx; repeats must be soft-masked (lower case) in the genomic sequence |
-e <dist> |
Maximum distance (range) allowed from free ends of terminal exons of reference transcripts when assessing exon accuracy. By default, this is 100. |
-d <dist> |
Maximum distance (range) for grouping transcript start sites, by default 100. |
-p <tprefix> |
The name prefix to use for consensus/combined transcripts in the .combined.gtf file (default: 'TCONS') |
-C |
Discard the “contained” transfrags from the .combined.gtf output. By default, without this option, gffcompare writes in that file isoforms that were found to be fully contained/covered (with the same compatible intron structure) by other transfrags in the same locus, with the attribute “contained_in” showing the first container transfrag found. (Note: this behavior is the opposite of Cuffcompare's -C option). |
-A |
Like -C but will not discard intron-redundant transfrags if they start on a different 5' exon (keep alternate transcript start sites) |
-X |
Like -C but also discard contained transfrags if transfrag ends stick out within the container's introns |
-K |
For -C/-A/-X, do NOT discard any redundant transfrag matching a reference |
-T |
Do not generate .tmap and .refmap files for each input file |
-V |
Gffcompare is a little more verbose about what it's doing, printing messages to stderr, and it will also show warning messages about any inconsistencies or potential issues found while reading the given GFF file(s). |
--debug |
Enables debug mode, which enables -V and generates additional files: .Q_discarded.lst, .missed_introns.gtf and .R_missed.lst |
Gffcompare produces the following output files:
In this output file Gffcompare reports various statistics related to the “accuracy” (or a measure of
agreement) of the input transcripts when compared to reference annotation data (provided with the
-r option). These accuracy measures are calculated under the assumption that the input GFF/GTF
file(s) (the "query" transcripts, or transfrags, from one or multiple "samples") are coming from
some transcript discovery/assembly pipeline (e.g. Cufflinks or StringTie), or from any other
gene/transcript prediction pipeline. GffCompare can be used to assess the accuracy of such
pipelines, when comparing their results to a known reference annotation (provided with the -r
option). The measures of “sensitivity” and “precision” are calculated at various levels (nucleotide,
exon, intron, transcript, gene) for each input file and reported in this .stats file.
These generic accuracy metrics are calculated as described in Burset, M., Guigó, R. : Evaluation
of gene structure prediction programs (1996) Genomics, 34 (3), pp. 353-367. doi: 10.1006/geno.1996.0298
(please note that in that paper the authors used the term “Specificity” for what we currently call “Precision”). The following
general formulae are used for calculation of Sensitivity and Precision at various levels (base,
exon, intron chain, transcript, gene):
Sensitivity = TP / (TP+FN)
Precision = TP / (TP+FP)
Here TP means "true positives", which in this case are the query features (bases, exons, introns, transcripts, etc.) which agree with the corresponding reference annotation features. FN means "false negatives", i.e. features which are found in the reference annotation but missed (not present) in the "query" data. Accordingly, FP are features present in the input "query" data but not confirmed by any reference annnotation data. Notice that FP+TP amounts to the whole input set of "query" features (per sample/input file). If multiple "query" GTF/GFF files are given as input, these metrics are computed separately for each sample.
Sensitivity and Precision values are estimated at various levels, which are largely an
increasingly stringent way of evaluating the accuracy/correctness of a set of predicted (assembled)
transcripts (transfrags), when compared to the reference annotation provided with the -r option.
The levels are as follows:
- TP (true positives) number is the number of exon bases that are reported at the same coordinate on both the query (the assembled transfrag) and any reference transcript (that is, the overlap length of exons)
- FN (false negatives) is the number of bases in reference data exons which are not covered at all by any of the predicted transcripts(transfrags) exons;
- FP (false positives) then is the number of bases which are only covered by any predicted transcript's exons but not covered by any reference transcript exons
This works similarly to the Base level TP/FN/FP concept described above, but now the unit of comparison ("matching") is the exon interval on the genome, i.e. if an exon of the predicted transcript overlaps and matches the boundaries of a reference transcript exon, then it is counted as TP.
Similar to the Exon level, only now the units being "matched" and counted are the intron intervals instead of exon intervals: each intron of the predicted transcript is checked against any introns of the reference transcripts in the area and is there is one with the same exact start-end coordinates, it is counted as a TP.
Here we count as a TP any predicted (assembled) transcript for which all of its introns can be
found, with the same exact intron coordinates in a reference transcript (with the same number of
introns). Matching all the introns at this level is the same as matching all the internal exons, but
allowing for the possibility that the external boundaries of the terminal exons might not match at
all. However it is quite realistic to consider transcripts "matching" when their intron chains are
identical (and GffCompare does annotate "matching" transcripts with the class code '=' when intron
chains are the same), considering that:
- the reference annotation usually does not have perfectly accurate transcription start and stop coordinates for each transcript
- the biological transcription length may also be inexact, especially at the transcription end (3'), so the transcription start and stop may be slightly different within the same sample, and this may not impact the function of the transcript at all (e.g. for coding transcripts, whenever the start/stop codon is not affected).
It's important to note that Sensitivity and Precision values at this "Intron chain level" are calculated only by looking at multi-exon transcripts (for obvious reasons), so it completely ignores the single-exon transcripts, which are quite numerous in a RNA-Seq experiment (possibly due to a lot of transcriptional and alignment noise).
At this level all transcripts (single and multi-exon) are compared to any overlapping reference
transcripts in order to assess "matching" (TP). That means that besides the "Intron chain level"
matching which only applies to multi-exon transcripts, this analysis level also looks at single exon
transcripts and considers them "matching" when there is a very significant overlap with a single
exon reference transcript (while still allowing their boundaries to differ).
Using --strict-match option can make the accuracy estimation at this level much more stringtent by
only allowing a limited variation of the outer coordinates of the terminal exons (by at most 100
bases by default, but this value can be changed with the -e option).
At this level gffcompare considers that an observed locus (cluster of exon-overlapping transcripts) "matches" a similarly built reference locus (i.e. by clustering transcripts by exon overlaps), and thus counts as a TP at this level, if at least one predicted transcript has a "Transcript level match" with a reference transcript in the corresponding (overlapping) reference locus.
The XLOC_ prefix is assigned to super-locus identifiers in many of the GffCompare output files.
A super-locus is a region of the genome where predicted transcripts and reference transcripts
get clustered (grouped or linked) together by exon overlaps. When multiple samples (multiple GTF
files with assembled transfrags) are provided as input to GffCompare, this clustering is performed
across all the samples. Due to the transitive nature of this clustering by exon overlaps, these
super-loci can occasionally get very large, sometimes merging a few distinct reference gene regions
gene regions.
Not all super-loci have reference transcripts assigned, sometimes they are just a bunch of
transfrags clumped together, possibly from multiple samples, all linked together by exon overlaps,
with no reference transcripts present in that region.
When multiple input (query) GTF/GFF files are provided, Gffcompare reports a GTF file containing the
“union” of all transfrags in each sample. If a transfrag with the same exact intron chain is present
in both samples, it is thus reported only once in the combined.gtf output
If a single GTF/GFF query file is provided as input and no specific options to remove
"duplicated"/redundant transfrags were given (-D, -S, -C, -A, -X), GffCompare outputs a file
called .annotated.gtf instead of .combined.gtf Its format is similar
to the above, but preserves transcript IDs (so the -p option is ignored)
This file matches transcripts up between samples. This file matches transcripts up between samples. Each row represents a transcript structure that is preserved (structurally equivalent) across all the input GTF files. GffCompare considers transcripts "matching" (i.e. structurally equivalent) if all their introns are identical. Note that "matching" transcripts are allowed to differ on the length of the first and last exons, since these lengths can usually vary across samples for the same biological transcript.
If GffCompare was run with the -r option, the 3rd column contains information about the reference
annotation transcript that was found to be "closest" (best match or overlap) to the transcript
structure represented by this row.
Here's an example of a line from the tracking file, where GffCompare was run with two input files vs. a reference annotation (the \ characters here indicates that the next line should be in fact an extension of the current line) :
    TCONS_00403479    XLOC_006534    TCEA3|rna-XM_006710864.2    j    \
    q1:STRG.377|STRG.377.2|10|0.304785|0.760185|2.205239|2767    \
    q2:STRG.382|STRG.382.3|10|0.650162|1.688384|3.312878|3016
In this example an assembled transcript present in the two input files (q1 and q2), called STRG.377.2 in the first and STRG.382.3 in the second, doesn't fully match any reference transcript but shares some exon-intron junction(s) with reference transcript rna-XM_006710864.2 (which is an isoform of the reference gene TCEA3) and this type of reference overlap is indicated by the class code 'j'. The first 4 columns of this file are fixed, as follows:
| Column number | Column name | Example | Description |
|---|---|---|---|
| 1 | Query transfrag id | TCONS_00403479 | A unique internal id for the transfrag |
| 2 | Query locus id | XLOC_006534 | A unique internal id for the super-locus containing these transcripts across all samples and the reference annotation |
| 3 | Reference gene id | TCEA3|rna-XM_006710864.2 | The gene name and transcript ID of the reference record associated to this transcript (separated by '|'), or '-' if no such reference transcript is available |
| 4 | Class code | c | The type of overlap or relationship between the reference transcripts and the transcript structure represented by this row |
Each of the columns following the 4th column shows the transcript from each sample, in the following format (assuming that FPKM, TPM and coverage values were found in the transcript attributes):
qJ:<gene_id>|<transcript_id>|<num_exons>|<FPKM>|<TPM>|<cov>|<len>
A transcript need not be present in all samples in order to be reported in the tracking file. A sample not containing a structurally equivalent transcript will have a '-' in its corresponding column, so a transcript present in only one sample will have a '-' character in all the other columns corresponding to the other samples.
Note: the .refmap and .tmap output files described below are created for each query
<input_file> given, in the same directories where those input files reside.
This tab-delimited file lists, for each reference transcript, which query transcript either fully or partially matches that reference transcript. Note that one such output file is generated for each of the query <input_files> given, in the directory where that input file resides (which might not be the current working directory). This file has one row per reference transcript, and the columns are as follows:
| Column number | Column name | Example | Description |
|---|---|---|---|
| 1 | Reference gene | Myog | The gene_name attribute of the reference GTF record for this transcript, if present. Otherwise gene_id is used. |
| 2 | Reference transcript id | uc007crl.1 | The transcript_id attribute of the reference GTF record for this transcript |
| 3 | Class code | c | The type of match between the query transcripts in column 4 and the reference transcript. One of either ‘c’ for partial match, or ‘=’ for full match. |
| 4 | Matches | STRG.223|STRG.223.1,STRG.224|STRG.224.1 | A comma separated list of transcripts matching the reference transcript |
This tab delimited file lists the most closely matching reference transcript for each query transcript. Note that one such output file is generated for each of the query <input_files> given, in the directory where that input file resides (which might not be the current working directory). This file has one row per query transcript, and the columns are as follows:
| Column number | Column name | Example | Description |
|---|---|---|---|
| 1 | Reference gene name | Myog | The gene_name attribute of the reference GTF record for this transcript, if present. Otherwise gene_id is used. |
| 2 | Reference transcript id | uc007crl.1 | The transcript_id attribute of the reference GTF record for this transcript |
| 3 | Class code | c | The type of relationship between the query transcripts in column 4 and the reference transcript (as described in the Class Codes section below) |
| 4 | Query gene id | STRG.23567 | The query (e.g., Stringtie) internal gene id |
| 5 | Query transcript id | STRG.23567.0 | The query internal transcript id |
| 6 | Number of exons | 7 | The number of exons in the query transcript |
| 7 | FPKM | 1.4567 | The expression of this transcript expressed in FPKM |
| 8 | TPM | 0.000000 | the estimated TPM for the transcript, if found in the query input file |
| 9 | Coverage | 3.2687 | The estimated average depth of read coverage across the transcript. |
| 10 | Length | 1426 | The length of the transcript |
| 11 | Major isoform ID | STRG.23567.0 | The query ID of the gene's major isoform |
| 12 | Reference match length | 4370 | The length of the longest overlap with a reference, ‘-’ if there is no such exonic overlap |
If GffCompare was run with the -r option (i.e. comparing with a reference annotation), tracking rows
will contain a "class code" value showing the relationship between a transfrag and the closest
reference transcript (where applicable). If the -r option was not used the rows will all contain
“-” in their class code column. The same codes are also shown as the value of the attribute
"class_code" in the output GTF file. The class codes are shown below in decreasing order of their
priority.
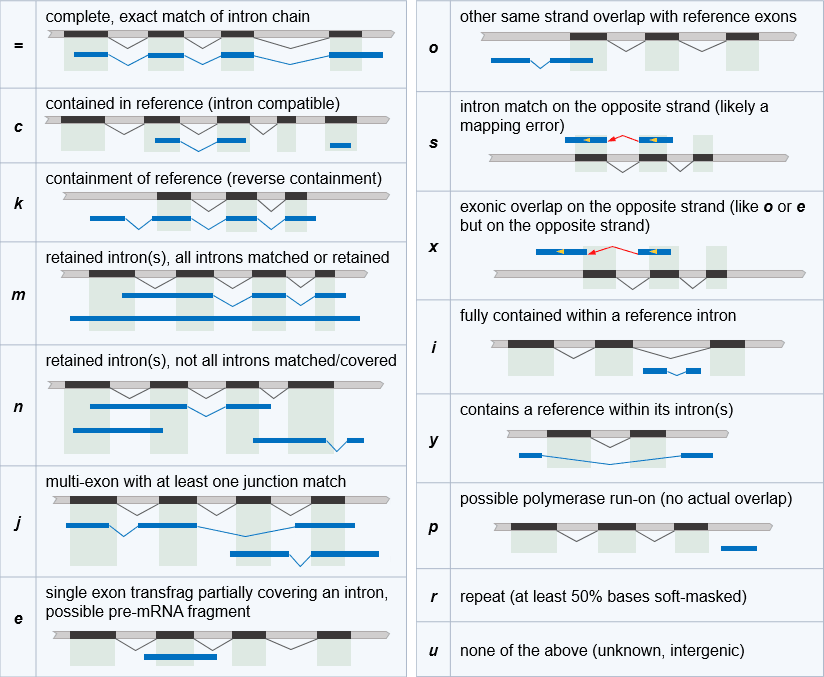
GffCompare's original purpose has been about assessing how accurately a set of "novel" ("query") transcripts matches a reference annotation. In order to properly evaluate precision and sensitivity when comparing two sets of transcripts, special care must be taken for "duplicate" or "redundant" entries within each set.
GffCompare tries to detect and remove such duplicate transcripts, and it uses slightly different assumptions for the reference set (the one given with the -r option) compared to the "query" set. GffCompare is by default more strict when assessing redundancy in the reference set than in the query set. This "stringency" also affects differently single-exon transcripts (SETs) and multi-exon transcripts (METs):
- When loading the reference transcripts:
- SETs (single exon transcripts) are considered "duplicated" (i.e. matching and redundant) if the shorter one is fully contained within the boundaries of the larger one AND if the shorter one is at least 80% of the length of the larger one
- METs are considered redundant if they have a fully matching intron chain AND if the boundaries of the shorter transcript are fully contained within the boundaries of the larger one (so the terminal exons of one transcript are both always longer or equal to the overlapping terminal exons of the other).
- When loading the "query" transcripts:
- SETs are considered redundant using a fuzzy "match" assessment like this:
- the overlapping region is >= 80% of the length of the larger transcript OR ( >=70% of the length of larger transcript AND >= 80% of the length of the shorter transcript) The latter clause seems a bit redundant but that particular check is also used somewhere else in gffcompare, namely for the "reverse containment" cases when we wanted to relax the way we assess a "match" with a reference when the reference is shorter than the query and possibly "almost contained" within the query.
- METs are considered redundant simply when they have the exact same intron chain (same number of introns with the same intron coordinates); their terminal exons do not have to be "boundary contained" in any way.
- SETs are considered redundant using a fuzzy "match" assessment like this:
Because of these different ways of assessing "redundancy" within the set of query transcripts vs. the reference transcripts, one may find that running GffCompare of a set of transcripts versus itself may in some cases lead to accuracy numbers that are NOT all 100% in the stats output file, if that set has transcripts which might be found "redundant" differently when the file is loaded as a "query" set compared to when the same file is loaded as a reference set.
GffCompare can be forced to use the same "redundancy" criteria for both query and reference data
sets by using the -S option which enforces the same "strict checking" of boundary containment
etc. for the "query" data set as for the reference data set.
Some pipelines can produce a very large number of potential or partial transcripts ("transfrags"),
for example when merging the transcript assemblies from tens or hundreds of RNA-Seq experiments
assemblies with stringtie --merge. Running GffCompare on such large GTF/GFF files could be slow
and memory intensive (because GffCompare always loads the whole transcript data in memory for
clustering etc.). One may only be interested to know if and how these many transcripts overlap
the reference annotation, and then further analyze only those which have specific types of overlaps
with the reference annotation transcripts (or none at all, i.e. if they do not overlap any of it,
which may be the case for putative novel transcripts).
That's where the trmap program comes in. trmap reports for each query transcript all the
reference that were found to overlap it, along with their overlap classification codes as described
in the GffCompare documentation above. The main feature of trmap is that it allows streaming of a
very large file with query transcripts (in GFF or BED format) to be checked and classified against a
reference annotation (again, in GFF or BED format).
trmap ("transcript vs. refererence mapping") first loads the reference annotation
file in memory as an interval tree and then streams the query file (which can also be provided at
stdin) while checking and reporting any overlaps found, and classifies the relationship with
reference transcripts using a (subset of) the "class codes" like those assigned by GffCompare.
trmap is distributed with GffCompare and it shares the same overlap classification code.
Usage:
  trmap [-S] [-o ] <ref_gff> <query_gff>

    Positional arguments:
      <ref_gff>    reference annotation file name (GFF/BED format)
      <query_gff>  query file name (GFF/BED format) or "-" for stdin
    Options:
      -o <outfile> write output to <outfile> instead of stdout
      -S           report only simple reference overlap percentages, without
                   classification (one line per query)
The default output is a pseudo-FASTA format showing a record for each query transcript that had at least one reference overlap/relationship.
Example:
The query transcript (MSTRG.36.1 in this example) is shown in the header of the record, with space
delimited fields showing the genomic location and strand. Each reference overlap follows, as a line
with tab delimited fields, starting with the "classification code" for the overlap and then
providing the genomic location of the transcript (chromosome, strand, transcript-start,
transcript-end, reference_transcriptID, exons).
The exons for both query and reference transcripts are shown as comma delimited lists of
intervals.
These are all 1-based coordinates like in the GTF/GFF format (even when input is BED).