One of the nicer hidden features of ggplot2 is that points with infinite value
are plotted 'half' at the border of a plot, like in this toy example:
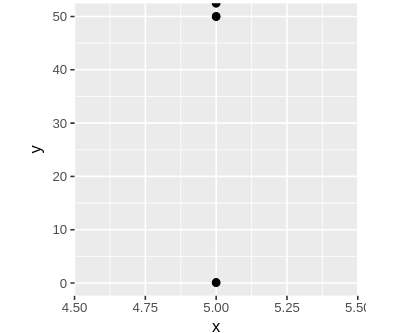
Currently, potnine drops infinite values.
Silently, unlike points otherwise outside the limit.
Even if the oob-function does return them, they're not plotted.
It would be nice to have this functionality in plotnine, at least optionally.
Together with an oob function that replaces values outside of the limits
with +-inf this would be really cool.
One of the nicer hidden features of ggplot2 is that points with infinite value

are plotted 'half' at the border of a plot, like in this toy example:
Currently, potnine drops infinite values.
Silently, unlike points otherwise outside the limit.
Even if the oob-function does return them, they're not plotted.
It would be nice to have this functionality in plotnine, at least optionally.
Together with an oob function that replaces values outside of the limits
with +-inf this would be really cool.