Getting started
hastic-server should be up and running.
- Open Grafana
- Navigate to
Configuration - pluginstab in grafana
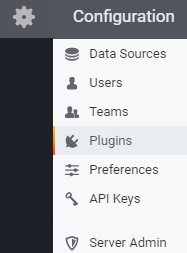
- Select
Hasticapp from the list

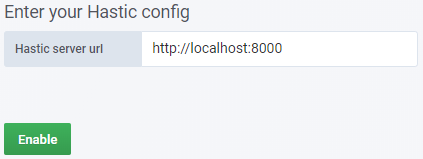
- Enter your
Hastic server urlinto the input field and clickEnable
- Create new dashboard in Grafana

- Add
Hastic graphpanel

- Open panel edit mode (click
panel titlemenu or press "e" hotkey)

- Navigate to
Metricstab. Set metrics. Only one metric supported

Read next: Analytic Units
Please note that hastic-panel doesn't use Grafana`s saving mechanism from v0.2.7, learn more why.