3.Plotting
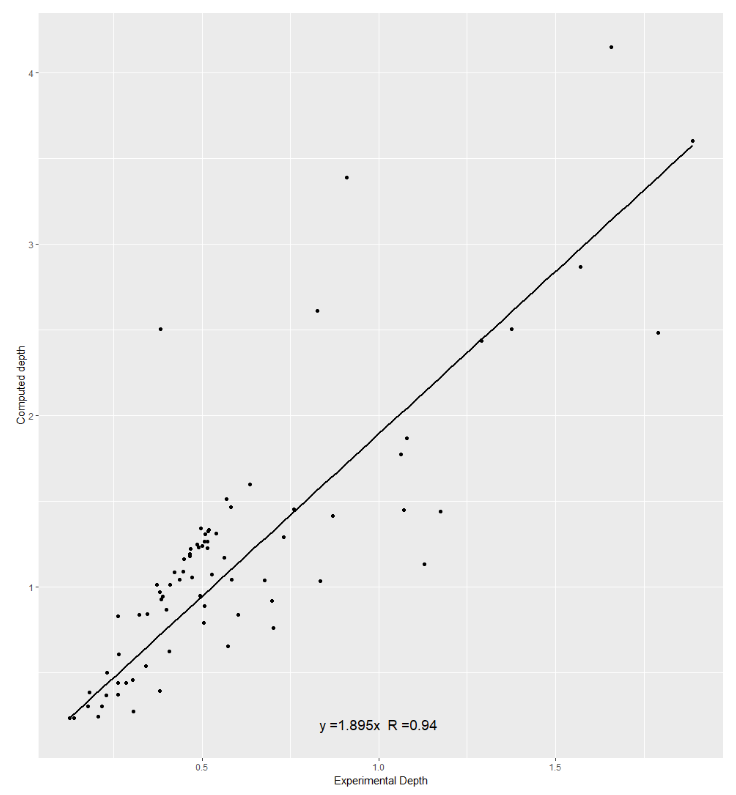
To observe the model and its equation, the following script could be used:
coef_test <- paste(c("y =",format(robust_linear_regression$coefficients,digits=4),"x  R =",formatC(summary(robust_linear_regression)$r.squared,format="f",digits=2)),collapse='')
ggplot(data=data, aes(x=Experimental_Depth, y=Computing_Depth)) +
  geom_point() +
  geom_smooth(method = "lmrob",formula = y~0 + x, se = FALSE,color = "black",size=0.9)+
  annotate("text", x=1, y=0.2, size=5, label = coef_test)+
  ylab("Theorical depth")+
  xlab("Experimental Depth")+
  theme(legend.position="none")
if everything worked as expected, you should obtain this picture: