3.5 Debugging
A Java debugger can be attached to a running instance of the jazz development environment, in order to set breakpoints etc. This section demonstrates how to attach the IntelliJ Debugger to a running instance of the jazz development environment.
Before we start, launch a run time by any of the documented means, such as creating a run task as demonstrated in using intellij
This example will again use the plugin created in the plugins section. If you haven't followed those instructions, we highly recommend you do so before continuing here.
The jazz development environment can be debugged by attaching a remote debugger.
- Go to
Run -> Edit Configurations - Add a new configuration by pressing the plus button in the upper left hand corner
- Select the remote debugging template
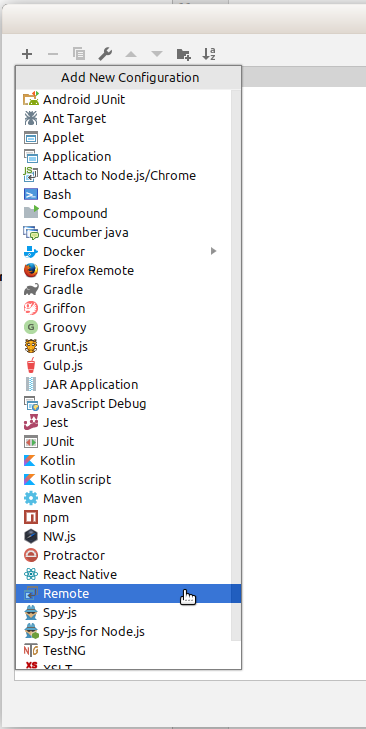
- Give your new debugging configuration a sensible name, check the
Single instance onlycheckbox and make sure to set the port to 9999
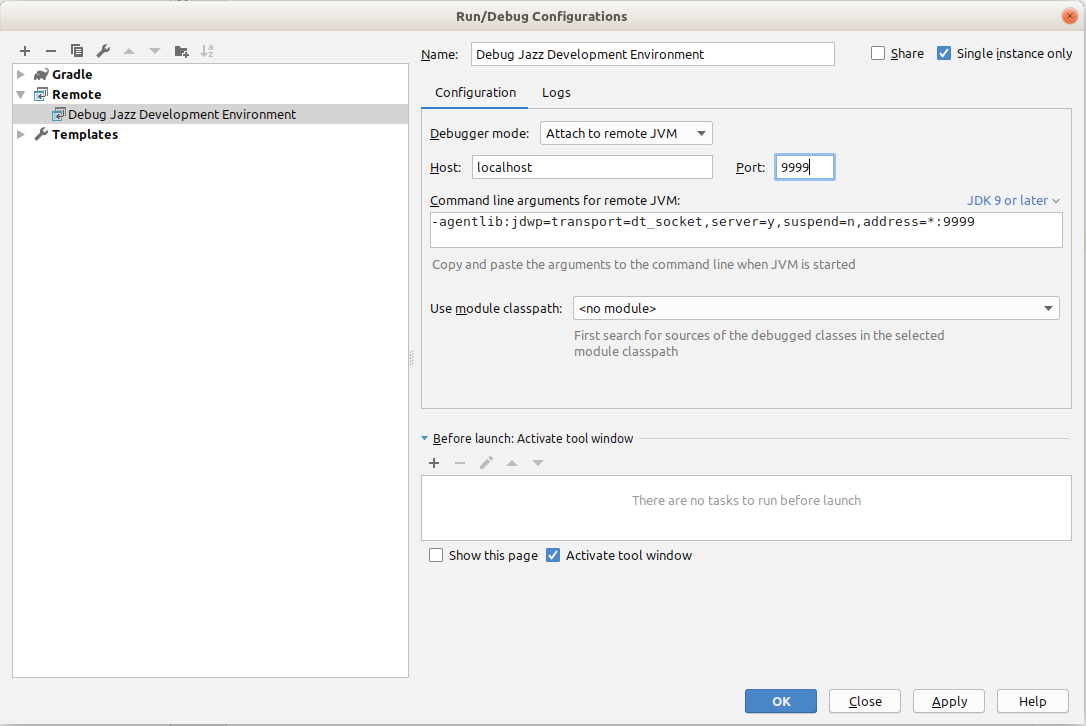
Save your new debug configuration by hitting OK
- You can now go to
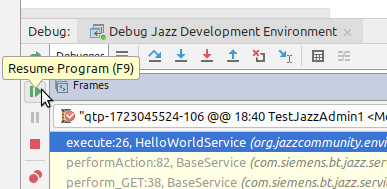
Run -> Debug 'Debug Jazz Development Environment'to attach IntelliJ to the running Jazz instance. After successfully attaching, the debug view at the bottom of the screen should appear:
For a full guide to debugging in IntelliJ, please refer to the Jetbrains Debugging Manual.
- We can set break points, for example by clicking in the margin next to the line numbers in the editor.
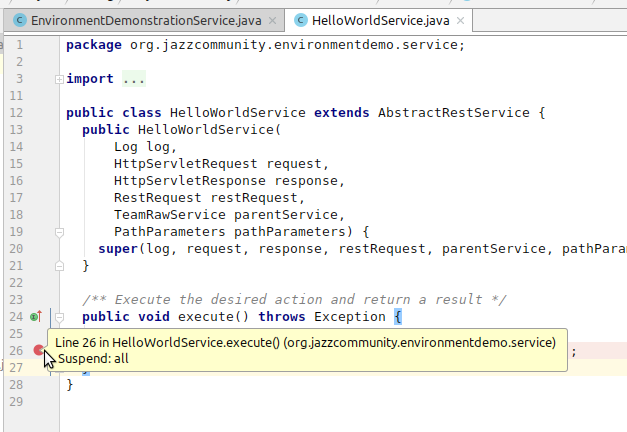
Or by pressing Ctrl + F8 with the cursor on the line.
- Once the break point is set, we have to make sure to hit it. In the case of our example, we can navigate to the url of our service: https://localhost:7443/jazz/service/org.jazzcommunity.environmentdemo.IEnvironmentDemonstrationService/helloWorld. You will notice that the website doesn't finish loading. That is because IntelliJ has paused execution at the break point.
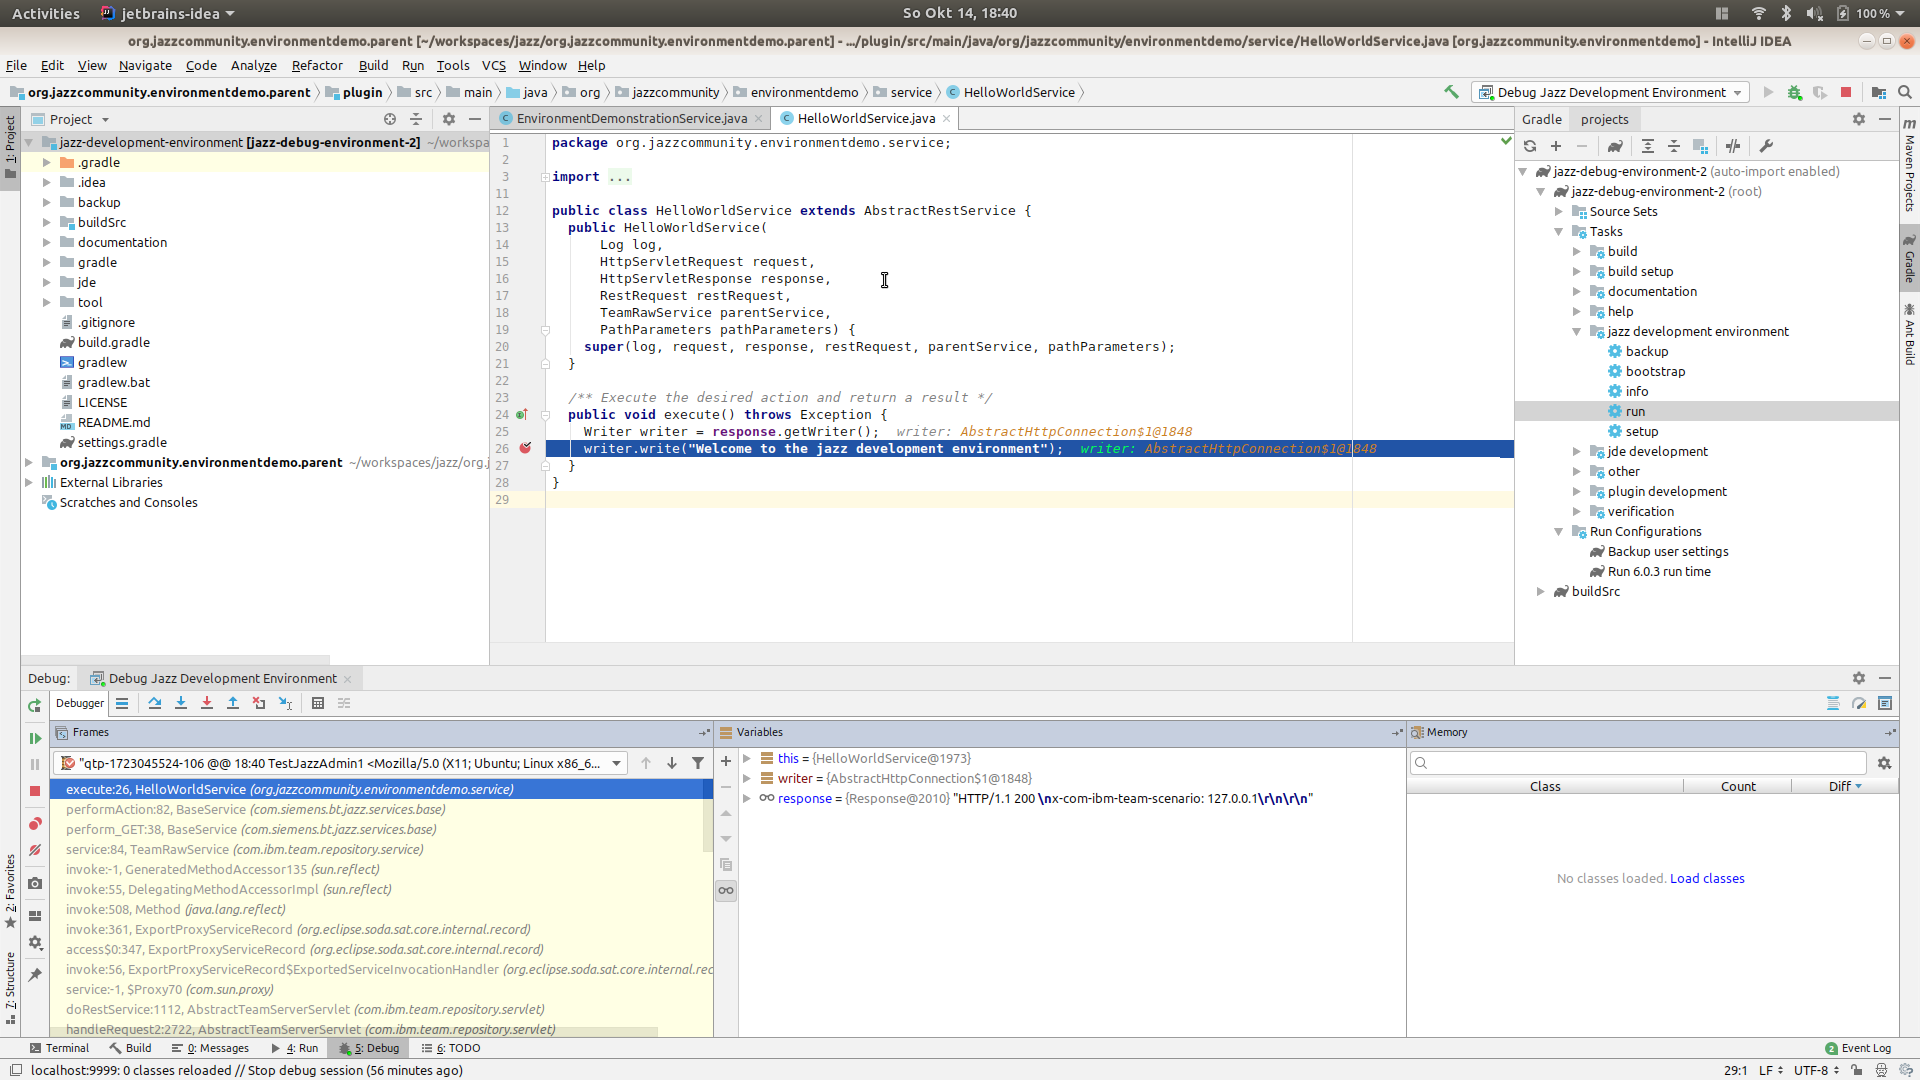
- To continue execution, you can press the
Resume Programbutton, or hitF9.
For a full guide to debugging in IntelliJ, please refer to the Jetbrains Debugging Manual.
The provided development environment supports a few hot reloading features. This means that some changes to your code do not require the server to be restarted. Instead, freshly compiled class files are automatically loaded again at run time. There are limitations to this procedure, such as not being able to load new methods, or other structural changes to classes etc., but it is a neat way of enhancing existing code at run time.
- Hot reload is automatically enabled, but you need to attach the debugger first.
- To demonstrate the functionality, let's first change some code. Press
Ctrl + Nand start typing the class name to navigate to theHelloWorldServiceclass. This is where we previously set the break point. - Change the output on line 26 to be of a different string value:
writer.write("This will hot reload!");
- Rebuild the project by going to
Build -> Build Project(or hitCtrl + F9). - After compiling, IntelliJ will inform you of hot-reload capable changes:
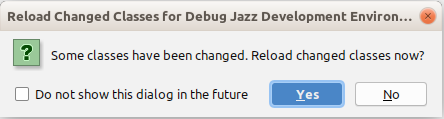
Confirm hot reload by pressing Yes
- Once the classes have been replaced, you will be notified by a notification at the bottom of your screen:

- If you reload the website now, you will see a different text.