plot-gsheets is a small wrapper around the Google Sheets API (v4) to provide more convenient way to plot Google Sheets from Python scripts.
This package runs under 3.5+, use pip to install:
pip install plot-gsheets>>> import plot_gsheetsSyntax:
plot_gsheets.get_columns(SPREADSHEET_ID,sheet_name)where SPREADSHEET_ID can be found like here in you google sheet URL:
https://docs.google.com/spreadsheets/d/SPREADSHEET_ID/edit#gid=0
and sheet_name can be found at the bottom left of window
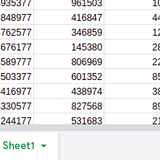
example:
>>> plot_gsheets.get_columns('1SrZfvr2ee54r7HR1jGtAE9zHIj_Y-UzK9ok8bdwkpqc','Sheet1')
['timestamp', 'average_sales', 'offer_price']Syntax:
plot_gsheets.plot_sheet_columns(SPREADSHEET_ID,sheet_name,x_column_name,y_column_name)sheet columns can be found by using plot_gsheets.get_columns and thus x_column_name,y_column_name can be specified by seeing output
example :
>>> plot_gsheets.plot_sheet_columns('1SrZfvr2ee54r7HR1jGtAE9zHIj_Y-UzK9ok8bdwkpqc','Sheet1','timestamp','average_sales')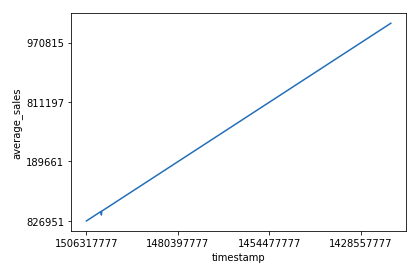
plot will be saved as plot.png
https://colab.research.google.com/drive/1yIW8wunsHVJiwRKltNQ7fBi9ph37Xqu2?usp=sharing