Better tile rendering #286
Conversation
Signed-off-by: Eric Culbertson <eculbertson@astraea.io>
|
TODO: I'd like to have a |
Signed-off-by: Eric Culbertson <eculbertson@astraea.io>
Signed-off-by: Eric Culbertson <eculbertson@astraea.io>
Signed-off-by: Eric Culbertson <eculbertson@astraea.io>
|
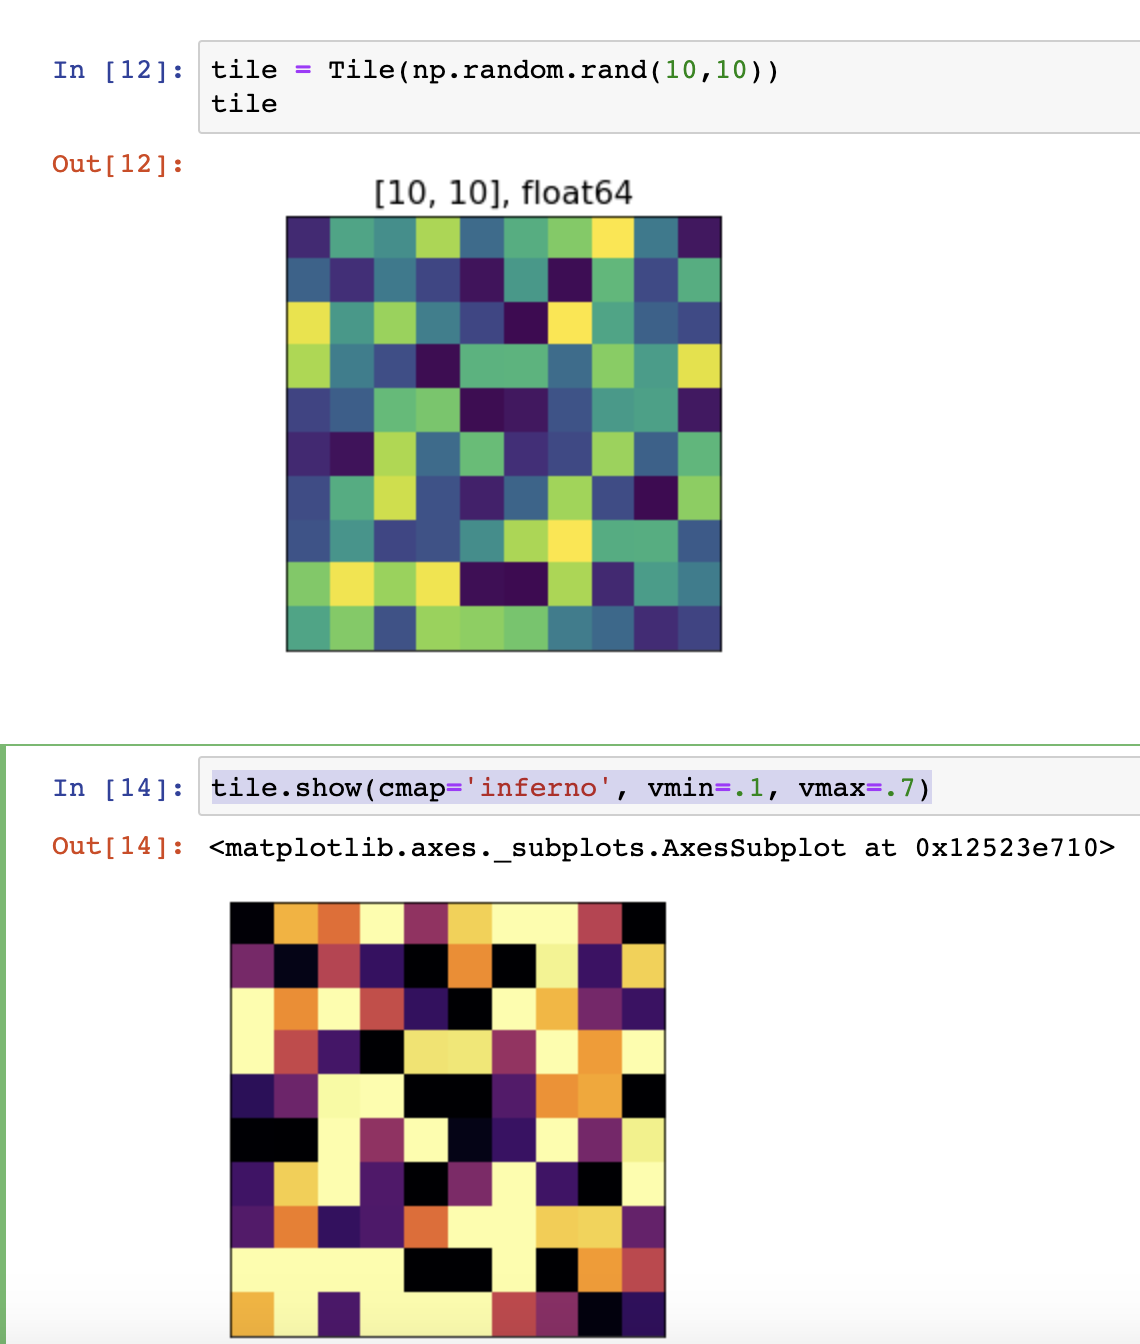
Ok so I changed my methodology a little bit and would love some feedback from @metasim @vpipkt and/or @courtney-whalen. I added a method to the Tile class called
The existing behavior of tile_to_png is unchanged, but this gives an easy way to do more custom tile plots. For example
|
|
Based on the quick look I like it and I think it's going to be a good contribution. Can you take a look at possibly rebasing your work off of the branch in #284 as it also makes some changes in the same module? |
|
So far I like it. I made some (not as good as) changes the same code, so there'll be a merge conflict when you update to the latest |
|
@emc5ud PS: definitely looks better!!! Thank you!! |
|
Thanks for taking a look. I might need some help with rebasing this branch off the one you linked. |
* develop: (26 commits)
  Set next development version.
  Tweaks to get .whl file under the default size limit on PyPi.
  Set version to 0.8.0.
  Removed tile display contrast fiddling.
  Quiet down pip; cache .local.
  Additional CI + Python dependency attempts.
  Final documentation tweaks.
  Move PegdownMarkdownFormatter to docs class
  Edits: languages.pymd & reference.pymd
  Fix setup.py dependency, fix rf_rasterize signature regression in unit test
  Edits: aggregation.pymd, supervised-learning.pymd, unsupervised-learning.pymd, time-series.pymd
  Edits: local-algebra.pymd, nodata-handling.pymd. Rendering tweaks.
  Edits: raster-write.pymd & vector-data.pymd.
  Python SetupTools + TravisCI == Painful Combo.
  Edits: raster-io.md, raster-catalogs.pymd, raster-read.pymd.
  Fixes to PDF generation code.
  Edits: concepts.md & getting-started.md.
  Edits: index.md & description.md
  Tweaks to time-series.pymd to lower memory pressure and remove SQL.
  Tweaked pweave markdown generator.
  ...

# Conflicts:
#	pyrasterframes/src/main/python/pyrasterframes/rf_ipython.py
running in ipython environment.
Signed-off-by: Eric Culbertson eculbertson@astraea.io
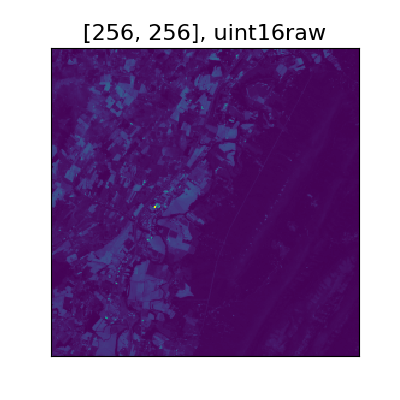
Default tile rendering is now more like QGIS. By default, the 1st and 99th percentile are calculated for the image, and then the cell values are clipped to not go beyond this range.
Before:
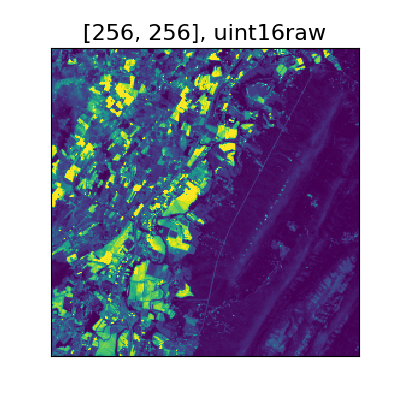
After: