openToolbox v0.17.0

openToolbox v0.17.0
Before this release
Two recurring workflow gaps showed up against the same shape of data: a
Kanban-style view of an entity's records (consent state, project phase,
priority tier) and a consistent set of charts next to the dashboard tiles.
The framework only shipped a list view and a tile dashboard, so users who
wanted either had to keep a separate tool and copy data over. The single
existing chart was a CSS bar block plus a lone SVG ring — inconsistent
between each other and easy to break with a malformed declaration.
What 0.17.0 ships
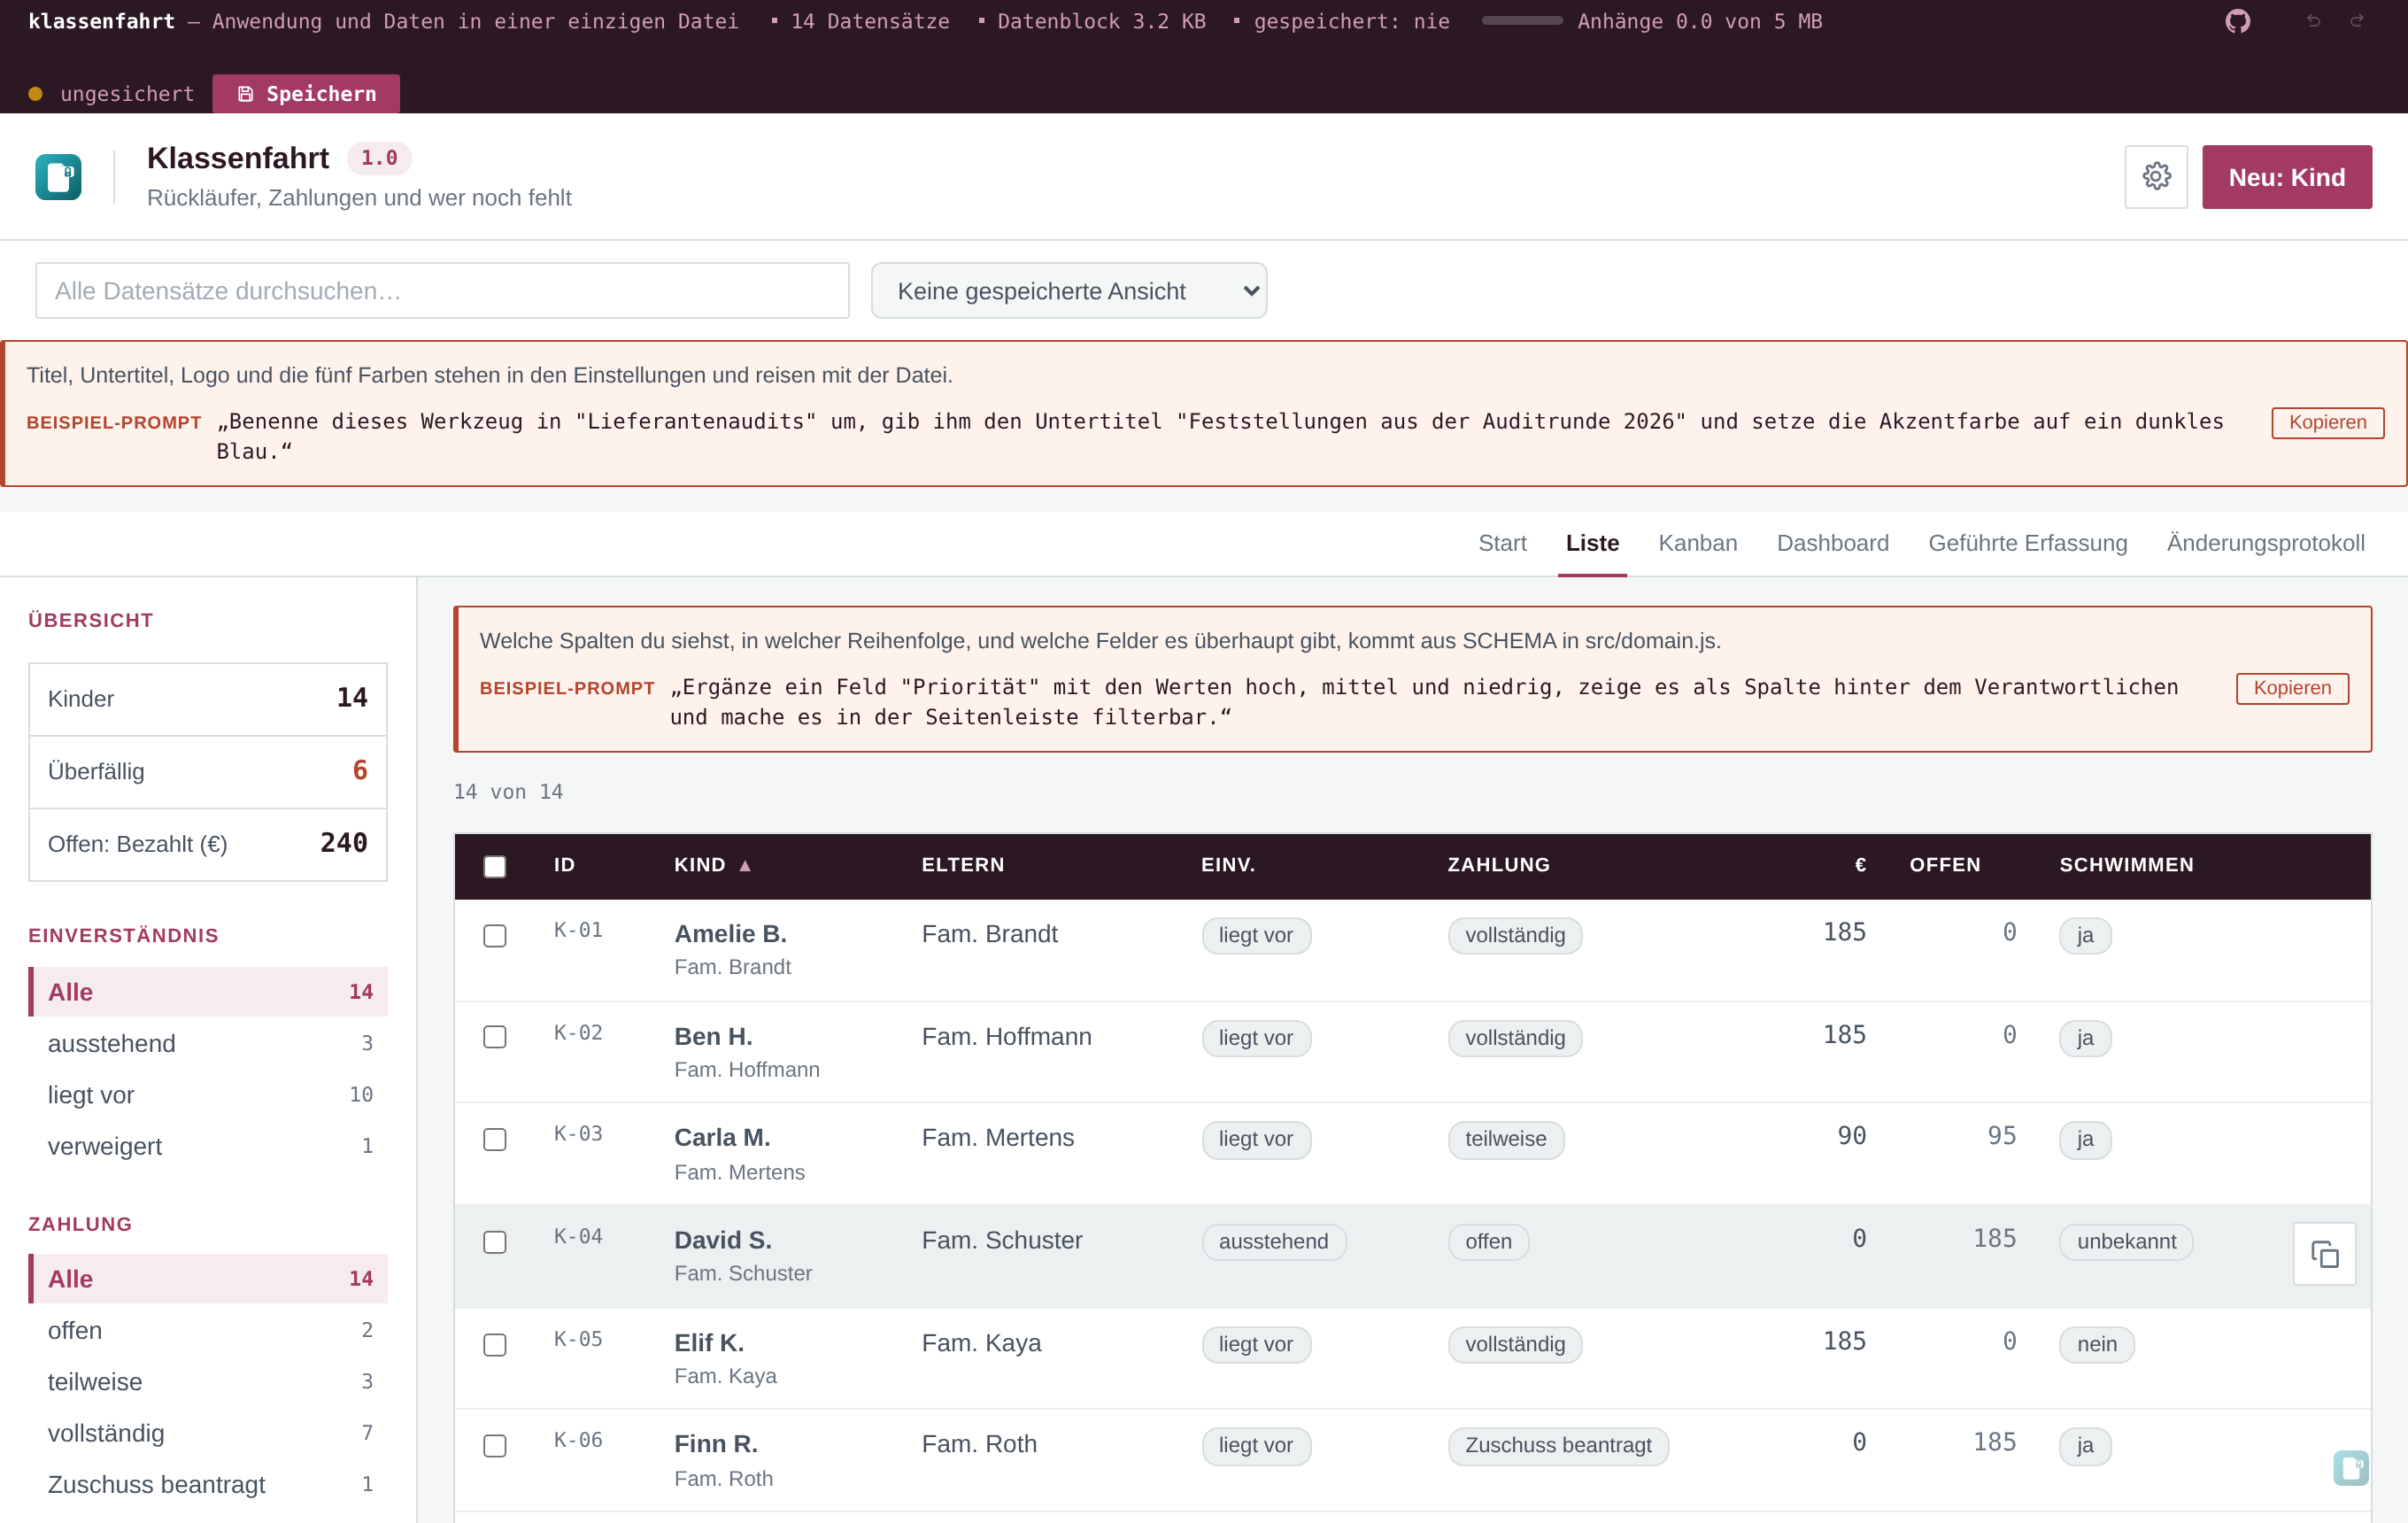
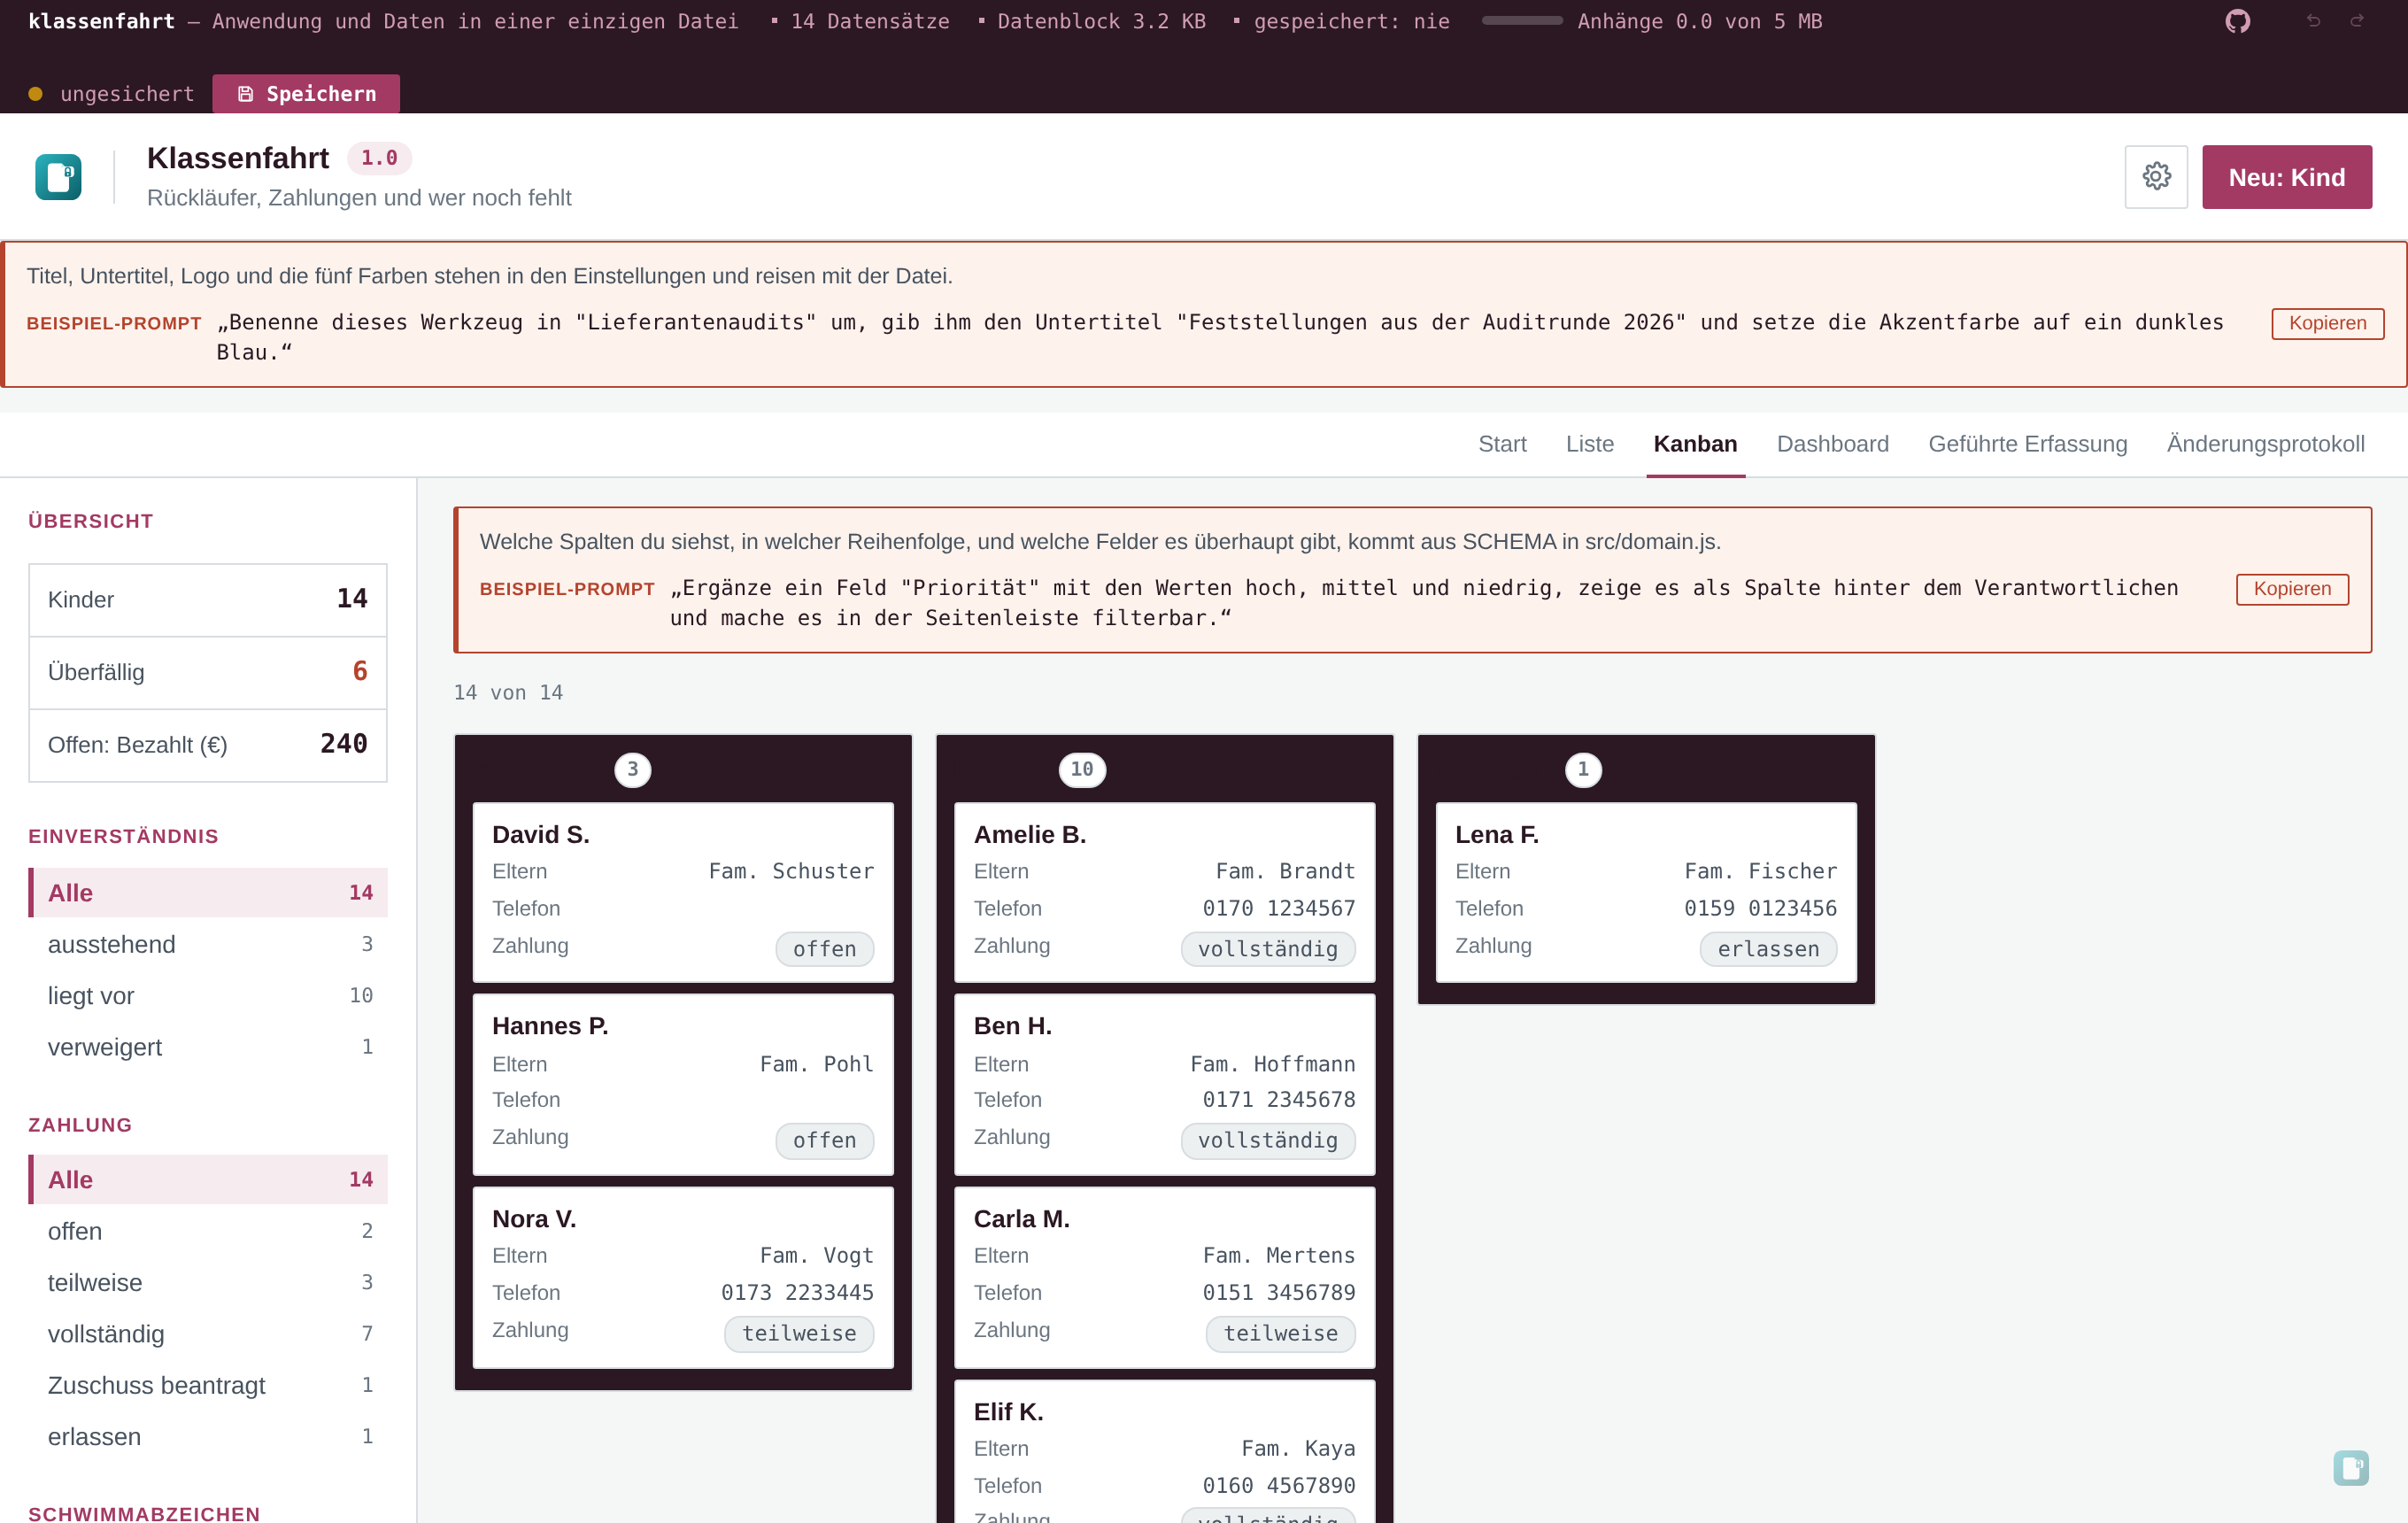
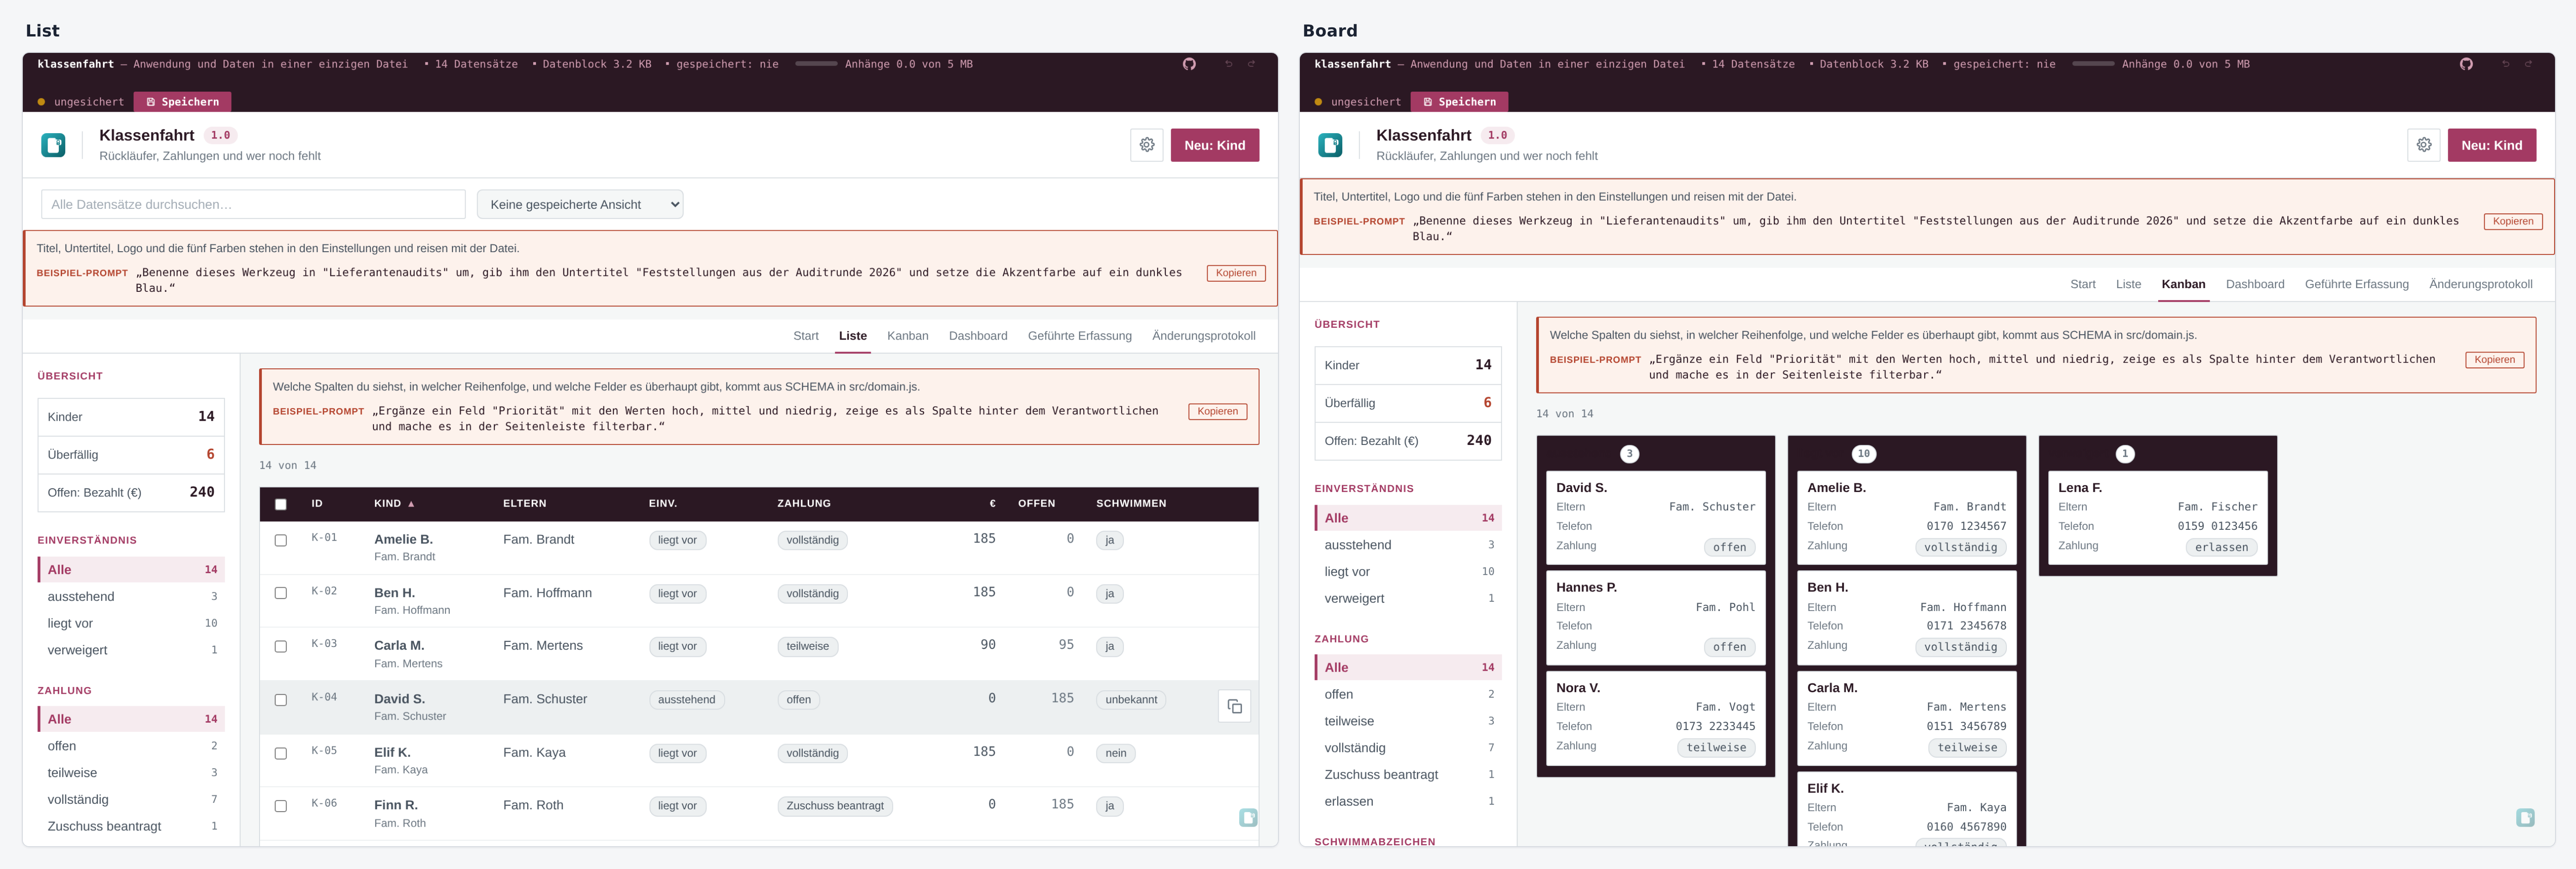
A view.board per entity (#79, demo in #80, docs in #82).
Opt-in via the schema declaration view.board: { columnField, cardFields, limit }. Dragging a card between columns writes through the same mutate
path the form uses, so the move lands in Undo/Redo and the change log
with one entry. Keyboard covers the same path end-to-end (Left / Right /
Enter / Escape), touch goes through the native HTML5 drag-and-drop API
so an attached iPad keyboard behaves identically. Records that no longer
match any declared value land in an "Unassigned" reservoir at the right
edge of the board — they stay findable instead of being silently
re-categorised. Global search and field filters act on the board the
same way they act on the table, so the filter the recipient set up
keeps working when they switch tabs.
Inline-SVG charts in the dashboard (#81, demo in #85).
The dashboard export now accepts a charts block alongside the existing
tiles: { type: 'chart', kind: 'bar' | 'donut' | 'line', ... }.
A new renderer in src/lib/charts.js replaces the CSS bars and the lone
SVG ring with one consistent code path. line aggregates per month
(count or sum(field)) and skips empty months instead of overdrawing.
validateChart surfaces malformed declarations as an objection tile in
the grid — no silent empty render. The renderer's sanitizeSvg contract
is enforced so no script, on* or external URL leaks into the output.
The print stylesheet switches to black-and-white hatching so the same
dashboard prints cleanly.

What changes for existing users
None, by design. v0.17.0 is a minor release and backwards-compatible
within the 0.17.x line. Domains that don't declare view.board or a
charts block behave identically to v0.16.1. The board, the dashboard
view, and the chart toggle only appear when the schema opts in, so an
existing payload opens the same way it did before. The renderer
replacement changes visual output for domains that already used the
old CSS bars — the new renderer matches the same intent but with
consistent geometry.
AGENTS.md and CLAUDE.md remain byte-identical, the same way they
have been since 0.16.0. CI's cmp check keeps matching.
Not included (consciously)
For the board:
WIP-limits, swimlanes, multi-select inside the board, and per-card
colours are out of scope at this version. The schema declares only
the four fields the board needs and no more.
For charts:
no drill-down, no per-series click action, no second axis, no
sparklines inside cards. A chart stays a tile — clicking it opens
the same drawer the rest of the dashboard opens, nothing more.
Where to start
- Live demo: https://m-dohmen.github.io/openToolbox/demos/
- Board walkthrough:
docs/demos/school-trip/(consent column,
view.board.columnField: 'consent') - Charts walkthrough:
docs/demos/portfolio/(Dashboard tab,
Projects by riskbar +Projects landing by monthline) - Full change log: CHANGELOG.md
- Wiki:
Kanban-Board.mdandDashboard-Diagrammepages in
openToolbox.wiki
Verification at the tag
npm ci— cleannpm run build—dist/index.html 275.34 kB, gzip 86.56 kBnpm test— exit 0, all 11 suites (prompts-metrics,
actions-delete-guard, timezone, domain-swap-crash, views, board,
charts, smoke, multi-entity, demos, timezone-examples)npm run build:demo— 42 prompts across 6 demos, no diff