Running CppTests
The primary tests in this repository are the CppTests. These are xUnit tests that exercise the MIEngine and OpenDebugAD7 code by debugging a real process through GDB/lldb-mi. This document explains how to set up and run the tests.
Here are the test projects that make the CppTests work:
- CppTests -- contains native debuggee projects, the test scripts and test configurations.
- DebugAdapterRunner (architecture) -- a C# test framework for driving DAP-based debuggers.
- Debugger Testing -- handles compiling, linking, and deploying test projects for specific platforms. Defines requests (commands), responses, and events. Built on top of the DebugAdapterRunner test library.
The tests require a .NET 8 SDK. Verify it is installed by running:
dotnet --list-sdksIf no 8.x SDK is listed, install one from https://dotnet.microsoft.com/download/dotnet/8.0.
-
Install MSYS2 (
winget install --id MSYS2.MSYS2 --silentor the installer). -
From
C:\msys64\usr\bin\bash.exe -lc "..."(or anmsys2_shell.cmd -mingw64window), install the toolchain:pacman -Syu --noconfirm pacman -S --needed --noconfirm mingw-w64-x86_64-toolchain
This provides
g++andgdbunderC:\msys64\mingw64\bin. -
Copy test\CppTests\TestConfigurations\config_msys_gdb.xml to
test\CppTests\config.xml, and edit it for your environment:- Update any CI-hardcoded paths (e.g., change
D:\a\_temp\msys64\mingw64\bin\…to match your install, such asC:\msys64\mingw64\bin\g++.exeandC:\msys64\mingw64\bin\gdb.exe). - If you want to run the tests from a non-MSYS shell (such as Visual Studio or Visual Studio Code UI), uncomment and edit the
Environmentsection to add the MSYS bin directories to thePath, based on your install directory.
- Update any CI-hardcoded paths (e.g., change
-
Make sure you have the Xcode command-line tools installed (
xcode-select --install). -
Copy test/CppTests/TestConfigurations/config_lldb.xml to
test/CppTests/config.xmland verify the paths are correct.
-
Make sure you have g++ and gdb installed (example:
sudo apt-get install -y gdb g++). -
Allow the tests to attach to debuggees and (for tests that exercise core dumps) write cores to the working directory:
echo 0    | sudo tee /proc/sys/kernel/yama/ptrace_scope
echo core | sudo tee /proc/sys/kernel/core_pattern
-
Copy test/CppTests/TestConfigurations/config_gdb.xml to
test/CppTests/config.xml.
Building the CppTests project automatically builds and deploys the debug adapter to the test output directory. There is no need to run separate build or publish scripts -- just make your product code change, then run the tests.
Note on test dependencies: Many tests have a
[DependsOnTest]attribute indicating they require another test to run first (typically a compilation test). For example,BreakpointBindingdepends onCompileKitchenSinkForBreakpointTests. When running individual tests, always run the dependent test first. When running all tests in a class, the test orderer handles this automatically.
- Open
src\MIDebugEngine-Unix.sln(orsrc\MIDebugEngine.sln). - Use Test Explorer to run or debug individual tests.
- The project references ensure that building CppTests automatically builds and deploys the debug adapter.
- Install the C# Dev Kit extension.
- Open the repository root folder.
- Use the Testing panel to discover and run tests from
test/CppTests.- Building happens automatically when you run a test.
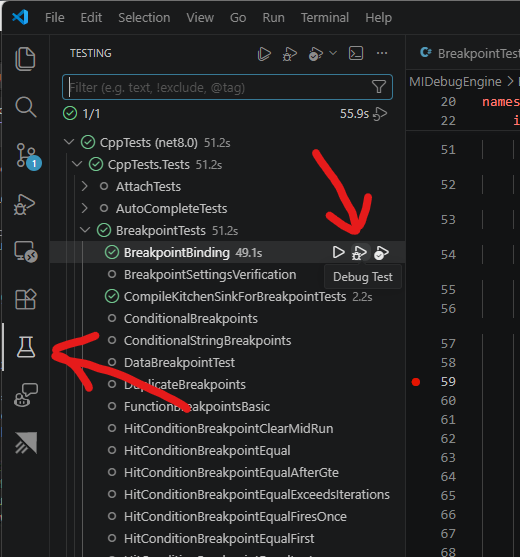
Run tests using dotnet test on the CppTests project:
# Run a specific test (use --filter)
dotnet test test/CppTests/CppTests.csproj --filter "FullyQualifiedName~CompileKitchenSinkForBreakpointTests"
dotnet test test/CppTests/CppTests.csproj --filter "FullyQualifiedName~BreakpointBinding"
Since the project references handle building and deploying, you do not need to build the solution separately -- dotnet test will build everything needed.
Code for the test itself runs in the test worker process, which will be automatically debugged when you launch from Visual Studio or VS Code. However, the MIEngine/MICode/OpenDebugAD7 code runs in a separate OpenDebugAD7 process, so you need to attach to it separately.
- Set a breakpoint in your test after the
CreateDebugAdapterRunner(settings)line. - Run the test in the debugger -- when the breakpoint hits, the OpenDebugAD7 process will be running.
- Use Debug → Attach to Process (VS) or the Attach launch configuration (VS Code) to attach a debugger to the
OpenDebugAD7process. - Once attached, continue execution in both debugger sessions.
- Install the Microsoft Child Process Debugging Power Tool (or whatever version matches your version of Visual Studio).
- Configure the CppTests project to enable mixed-mode debugging:
- In Solution Explorer, go to 'Debug Adapter Protocol Tests\CppTests'
- Right-click and select Properties.
- From the Debug tab, select Open debug launch profiles UI.
- Change Debug engines to Managed (automatic) with native (exact wording may vary by VS version).
- Open Debug → Other Debug Targets → Child Process Debugging Settings… and configure as follows:
- Check Enable child process debugging.
- Set <All other processes> to Do not debug.
- Add a new row for
OpenDebugAD7.exewith action Attach Debugger and Debugger Type of Managed (.NET Core, .NET 5+). - Save the options
- AttachTests failing
- Take a look at Troubleshoot attaching to processes using GDB