v0.1.6

vLLM Playground v0.1.6 - Observability Dashboard & Context Insights
Release Date: March 2026
This release adds a comprehensive Observability Dashboard with real-time vLLM server metrics, a PagedAttention Visualizer for KV cache insight, Token Counter & Logprobs Visualizer for per-token analysis, a Speculative Decoding Dashboard, and persistent user settings.
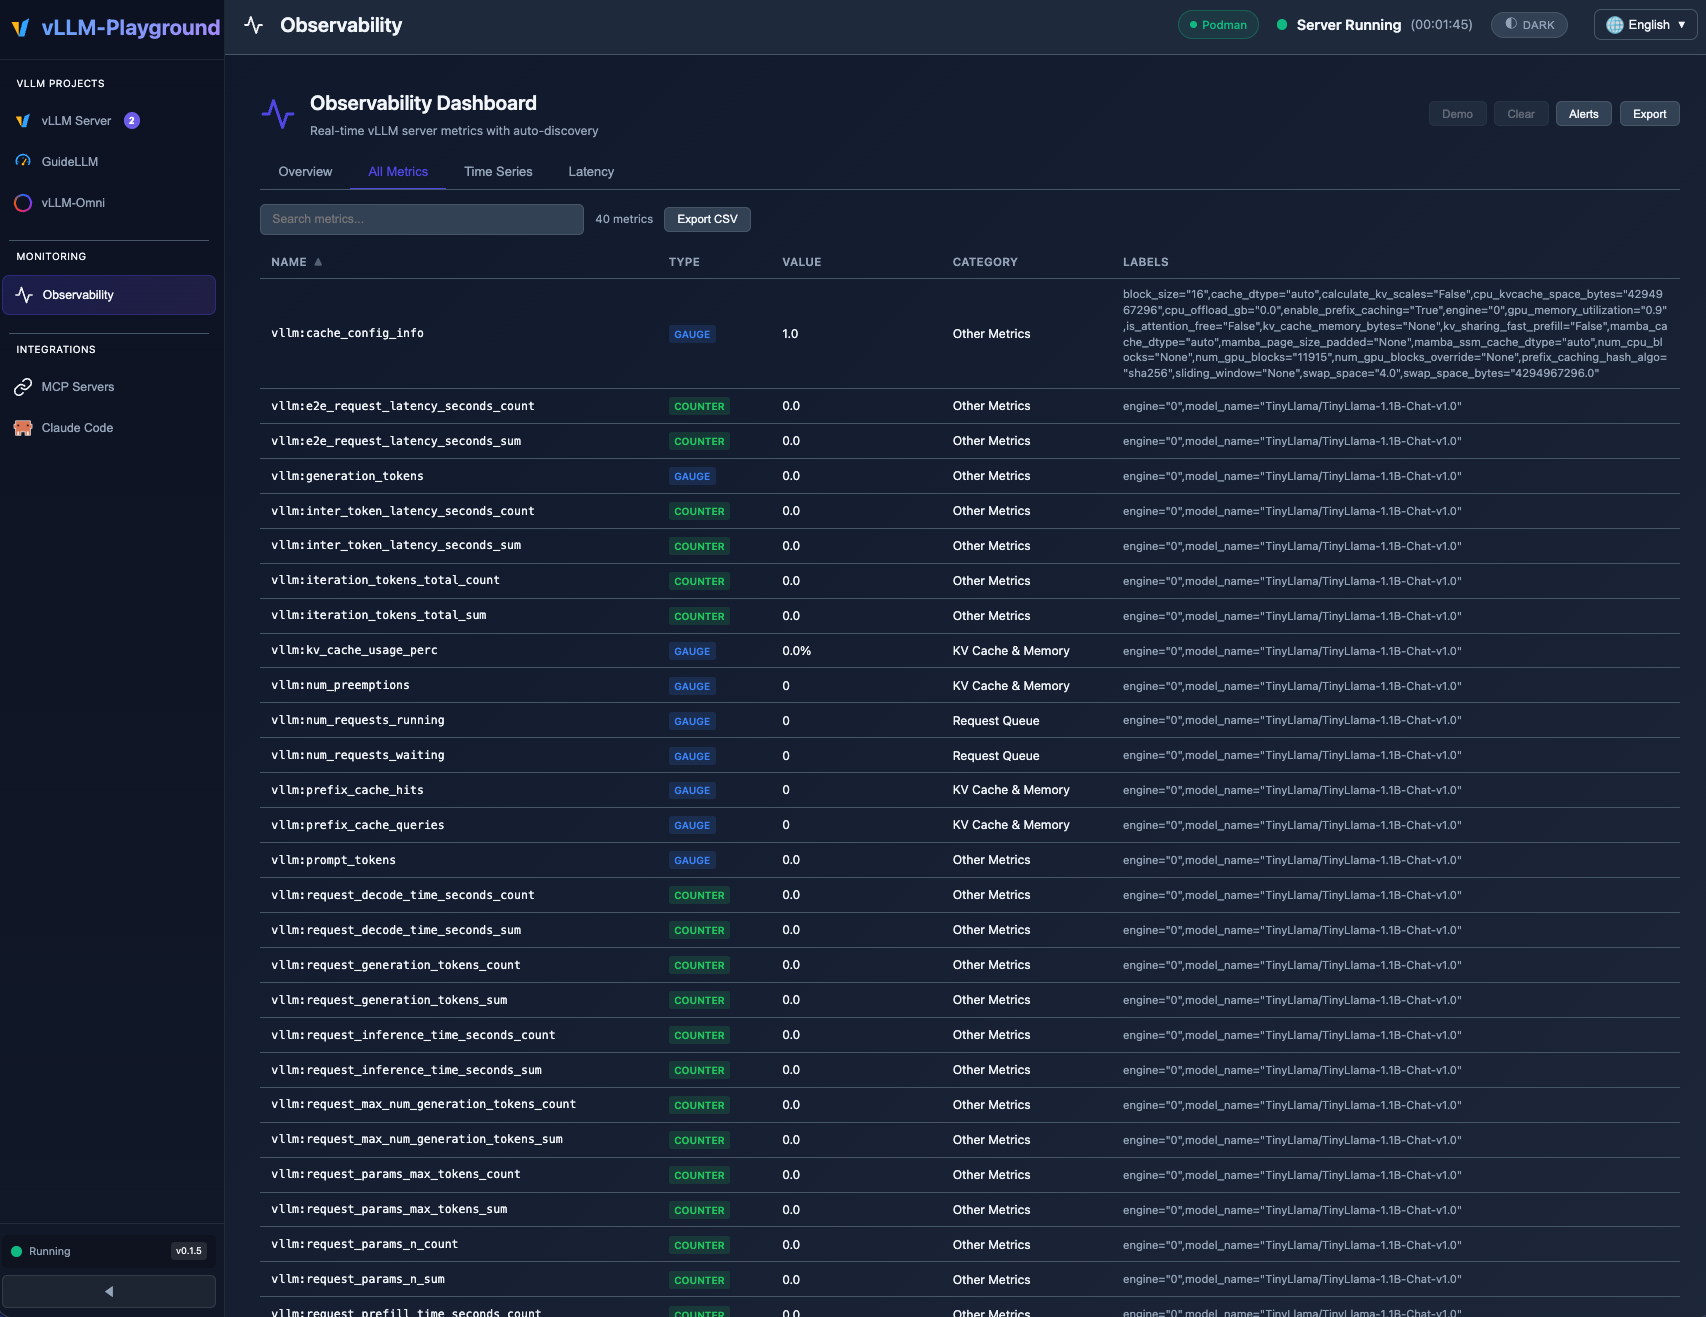
Real-time Observability Dashboard with auto-discovered vLLM metrics, category filtering, and threshold alerts.
Highlights
- Observability Dashboard - Full-page metrics dashboard with auto-discovery, time-series charts, and threshold alerts
- PagedAttention Visualizer - Real-time KV cache utilization heatmap with eviction alerts
- Token Counter & Logprobs - Live token estimation, per-token probability heatmap, and alternative token tooltips
- Speculative Decoding Dashboard - Acceptance rate, speedup factor, and token count tracking
- Settings Persistence - User preferences saved to
~/.vllm-playground/settings.json
Observability Dashboard
A dedicated full-page dashboard for monitoring vLLM server health and performance in real time. Access it from the Observability navigation item.
Overview Tab
Categorized metric cards with color-coded threshold indicators (normal / warning / danger):
| Category | Example Metrics |
|---|---|
| KV Cache & Memory | KV Cache Usage, GPU/CPU Cache Usage, Prefix Cache Hit Rate |
| Throughput | Prompt Throughput, Generation Throughput |
| Scheduling | Running Requests, Waiting Requests, Preemptions |
| Latency | Time to First Token (TTFT), Time per Output Token (TPOT), E2E Latency |
All Metrics Tab
Searchable, sortable table of every metric exposed by the vLLM /metrics endpoint. Unregistered metrics auto-appear with sensible defaults -- no configuration needed.
Time Series Tab
Interactive time-series charts powered by uPlot:
- Select any combination of metrics to plot
- Configurable time windows (1m, 5m, 15m, 1h)
- History persists across tab switches and page navigations
- Export metric data as JSON
Alerts
Configurable threshold alerts with visual and historical tracking:
- Per-metric warning and danger thresholds
- Alert history log with timestamps
- Alerts badge in the navigation sidebar
Generic Metrics Architecture
A new modular architecture powers the dashboard:
| Module | Purpose |
|---|---|
metrics-registry.js |
Single source of truth for metric metadata, categories, formats, and thresholds |
metrics-poller.js |
Pub/sub poller that fetches /api/metrics and distributes data to all subscribers |
observability.js |
Full-page dashboard UI with tabs, charts, and alerts |
Adding a new curated metric requires a single entry in the registry. The dashboard, sidebar, and alerts pick it up automatically.
PagedAttention Visualizer
Real-time visualization of vLLM's PagedAttention KV cache, displayed as a collapsible panel in the main chat view.
Features
- Block Heatmap - Canvas-rendered heatmap showing cache block utilization over time (up to 40 data points)
- Usage Gauge - Circular progress indicator for current KV cache usage percentage
- Prefix Cache Stats - Hit rate, total hits, and total queries
- Eviction Alerts - Three-level warning system:
- Normal (< 90% usage)
- Warning (90-95% usage)
- Critical (> 95% usage, preemptions detected)
Data is sourced from the shared metrics poller, so enabling the visualizer adds no extra API calls.
Token Counter, Logprobs & Speculative Decoding
Live Token Counter
A real-time token estimator displayed alongside the chat input:
- Input estimation - Approximates token count as you type (using server-side
/tokenizewhen available, falling back to character-based heuristic) - Conversation gauge - Tracks accumulated conversation tokens against
max_model_len - Visual indicator - Color-coded usage bar (green / yellow / red)
Logprobs Visualizer
Per-token probability visualization for assistant responses:
- Heatmap coloring - Tokens colored by confidence level (high >= 80%, medium >= 40%, low >= 10%, very low < 10%)
- Hover tooltips - Shows the probability and top alternative tokens for each position
- BPE-aware - Correctly decodes GPT-2 BPE and SentencePiece token formats
Enable logprobs in the chat settings to activate the visualizer.
Speculative Decoding Dashboard
Monitoring panel for speculative decoding when enabled on the vLLM server:
- Acceptance Rate - Percentage of speculated tokens accepted by the target model
- Speedup Factor - Measured speedup vs. standard autoregressive decoding
- Token Counts - Draft tokens generated, tokens accepted, tokens rejected
- Method Configuration - Supports Eagle, Eagle3, MLP Speculator, Medusa, MTP, and N-gram methods
- Demo Mode - Simulated data for testing the dashboard without a live speculative decoding setup
Settings Persistence
User preferences are now automatically saved to ~/.vllm-playground/settings.json and restored on startup.
Persisted Settings
| Setting | Description |
|---|---|
theme |
Dark or light theme |
locale |
Language preference (en, zh-CN) |
layout |
Panel sizes and arrangement |
vllm_run_mode |
Last used run mode (subprocess, container, remote) |
vllm_remote_url |
Remote server URL |
omni_run_mode |
vLLM-Omni run mode |
omni_remote_url |
vLLM-Omni remote URL |
Settings are saved on change and loaded on startup via /api/settings endpoints. The store uses atomic writes with backup files for crash safety.
Other Changes
Documentation (Community Contributions)
- Updated vLLM version reference to 0.15.0 in HTML template (#36) - @nussejzz
- Updated vLLM version to 0.15.0 in installation guide (#37) - @nussejzz
- OpenShift documentation patch: updated Containerfile, INSTALLATION.md, and README (#38) - @turbra
Installation
Stable Release
pip install vllm-playgroundFrom Source
git clone https://github.com/micytao/vllm-playground.git
cd vllm-playground
pip install -e .
vllm-playground
Documentation
- Changelog - Version history
- Installation Guide - Setup instructions
- vLLM Metrics Docs - vLLM metrics reference
Acknowledgments
- The vLLM Project team
- The uPlot library for time-series charts
- @nussejzz for documentation updates
- @turbra for OpenShift documentation patches
- Community contributors and testers
Links
- GitHub: https://github.com/micytao/vllm-playground
- PyPI: https://pypi.org/project/vllm-playground/
- vLLM Docs: https://docs.vllm.ai
Made with ❤️ for the vLLM community