ggstance implements horizontal versions of common ggplot2 Geoms, Stats, and Positions.
Get the development version from Github with:
# install.packages("devtools")
devtools::install_github("lionel-/ggstance")While coord_flip() can only flip a plot as a whole, ggstance
provides flipped versions of Geoms, Stats and Positions. This makes it
easier to build horizontal layer or use vertical positioning
(e.g. vertical dodging). Also, horizontal Geoms draw horizontal
legend keys to keep the appearance of your plots consistent.
Horizontal Geoms:
geom_barh()geom_colh()geom_histogramh()geom_linerangeh()geom_pointrangeh()geom_errorbarh()geom_crossbarh()geom_boxploth()geom_violinh()
Horizontal Stats:
stat_binh()stat_boxploth()stat_counth()stat_xdensity()stat_summaryh()
Vertical Positions:
position_dodgev()position_dodge2v()position_nudgev()position_fillv()position_stackv()position_jitterdodgev()
To create a horizontal layer in ggplot2 with coord_flip(), you have
to supply aesthetics as if they were to be drawn vertically:
library("ggplot2")

# Vertical
ggplot(mpg, aes(class, hwy, fill = factor(cyl))) +
  geom_boxplot()

# Horizontal with coord_flip()
ggplot(mpg, aes(class, hwy, fill = factor(cyl))) +
  geom_boxplot() +
  coord_flip()
In ggstance, you supply aesthetics in their natural order:
library("ggstance")

# Horizontal with ggstance
ggplot(mpg, aes(hwy, class, fill = factor(cyl))) +
  geom_boxploth()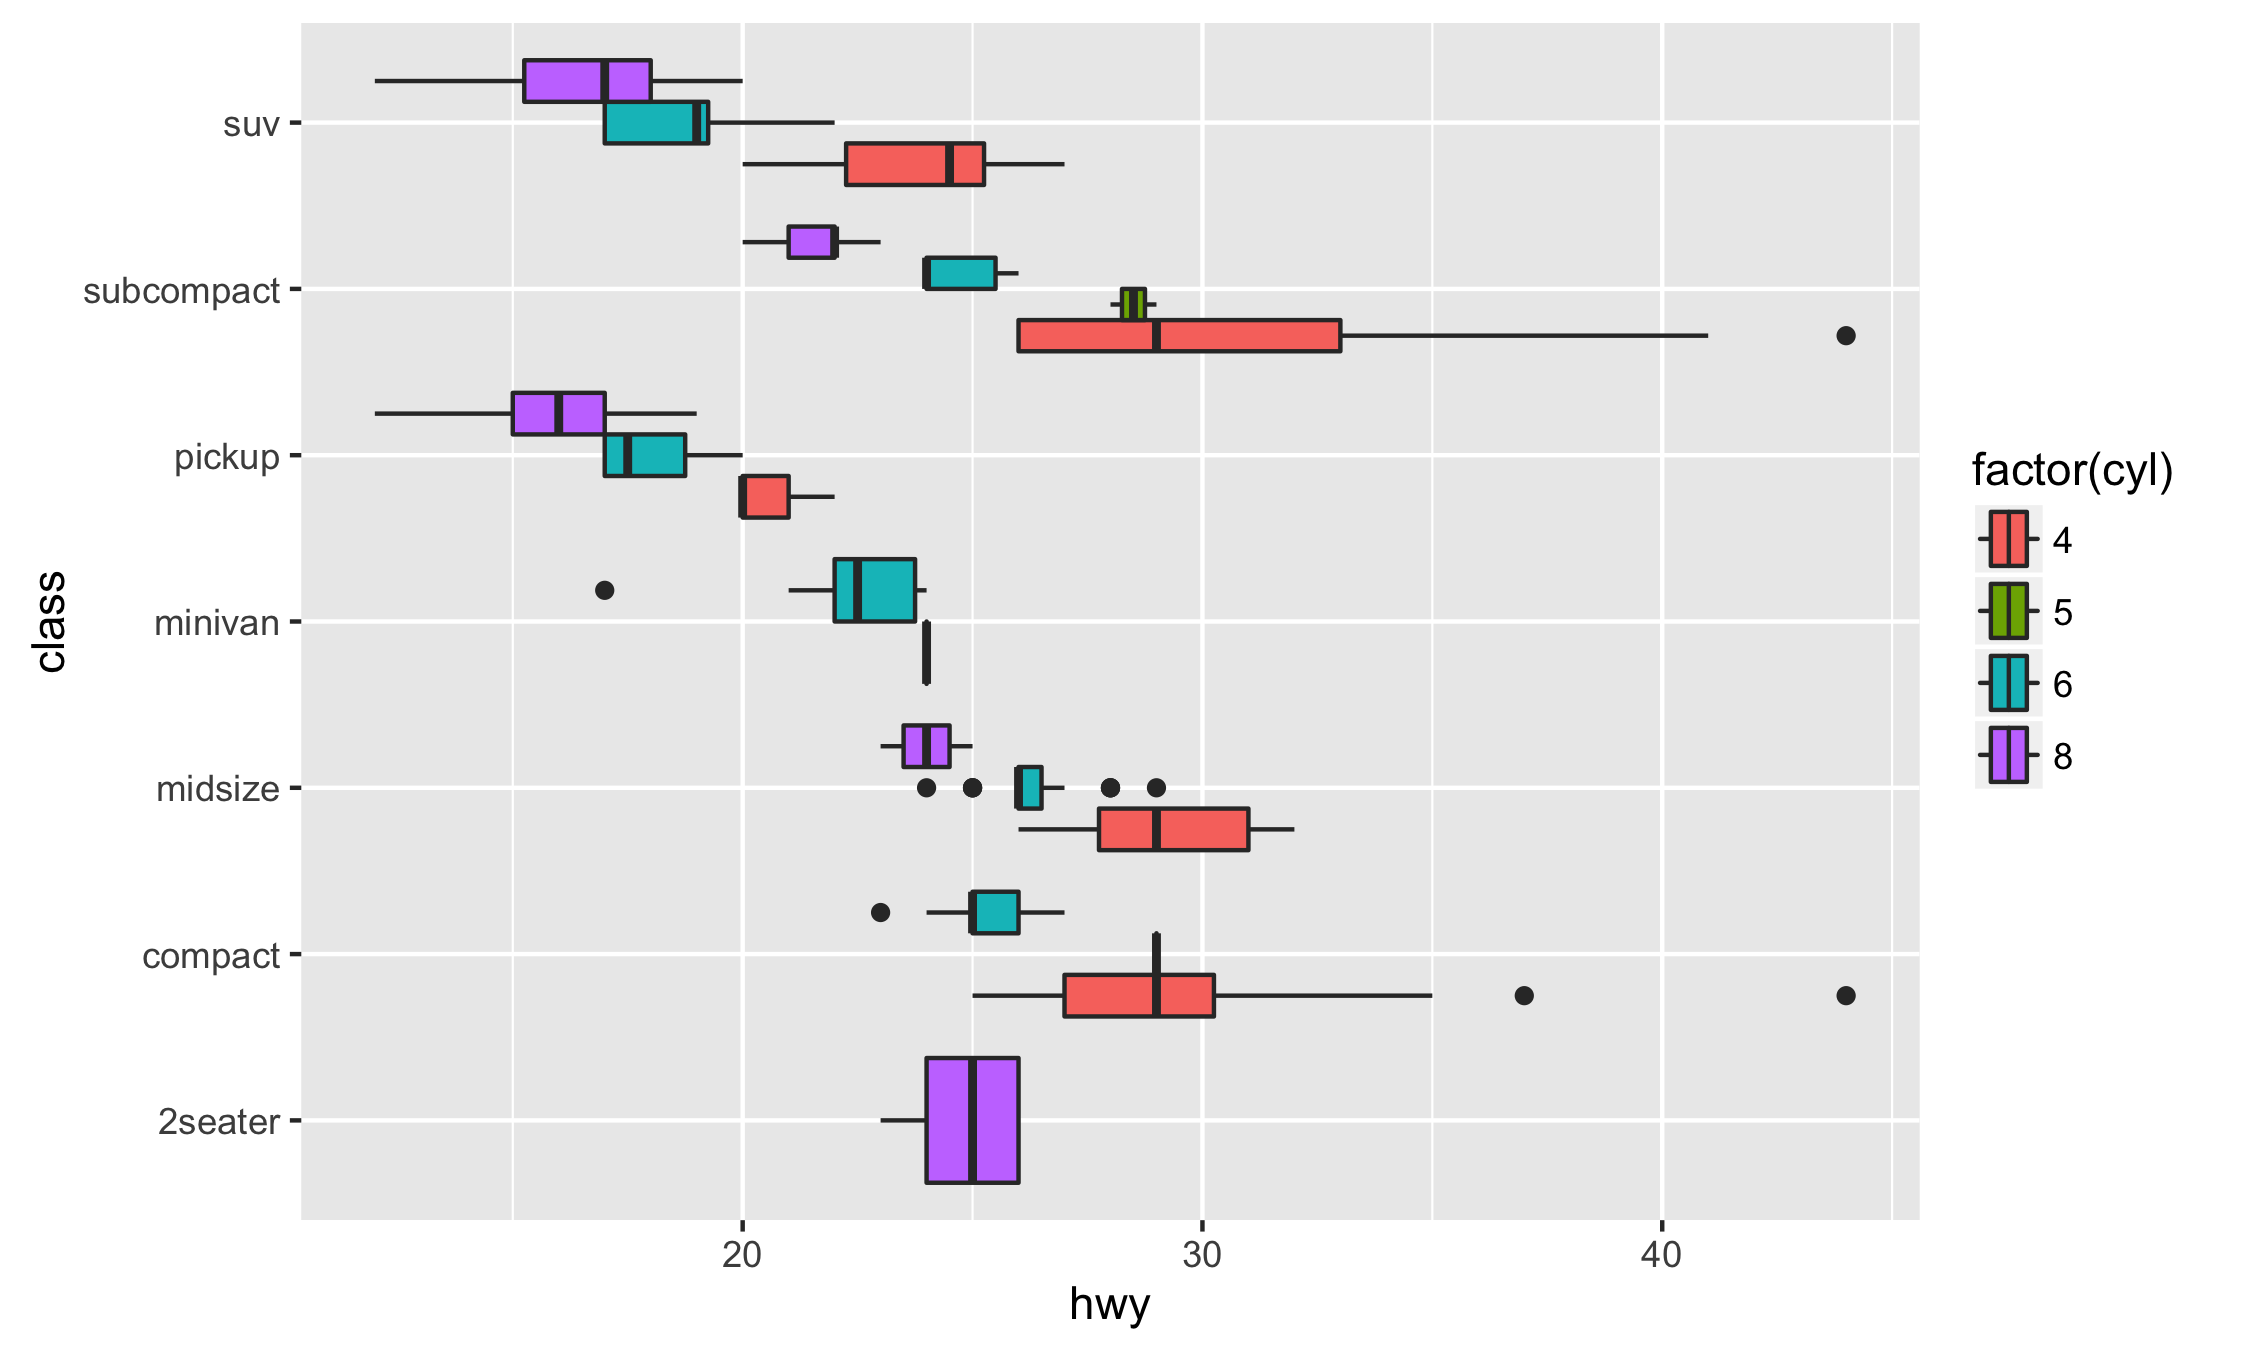
Some plots are hard to produce with coord_flip(). One case is
facetting with free scales. Here is an example from @smouksassi:
library("ggplot2")
library("ggstance")

df <- data.frame(
  Group = factor(rep(1:3, each = 4), labels = c("Drug A", "Drug B", "Control")),
  Subject = factor(rep(1:6, each = 2), labels = c("A", "B", "C", "D", "E", "F")),
  Result = rnorm(12)
)

vertical <- ggplot(df, aes(Subject, Result))+
  geom_boxplot(aes(fill = Group))+
  facet_grid(. ~ Group, scales = "free_x")
vertical
How do we flip this plot? With coord_flip(), the free scales are not
flipped correctly:
vertical + coord_flip()
vertical + facet_grid(Group ~ ., scales = "free_x") + coord_flip()
On the other hand a ggstance horizontal layer will work properly:
horizontal <- ggplot(df, aes(Result, Subject))+
  geom_boxploth(aes(fill = Group))+
  facet_grid(Group ~ ., scales = "free_y")
horizontal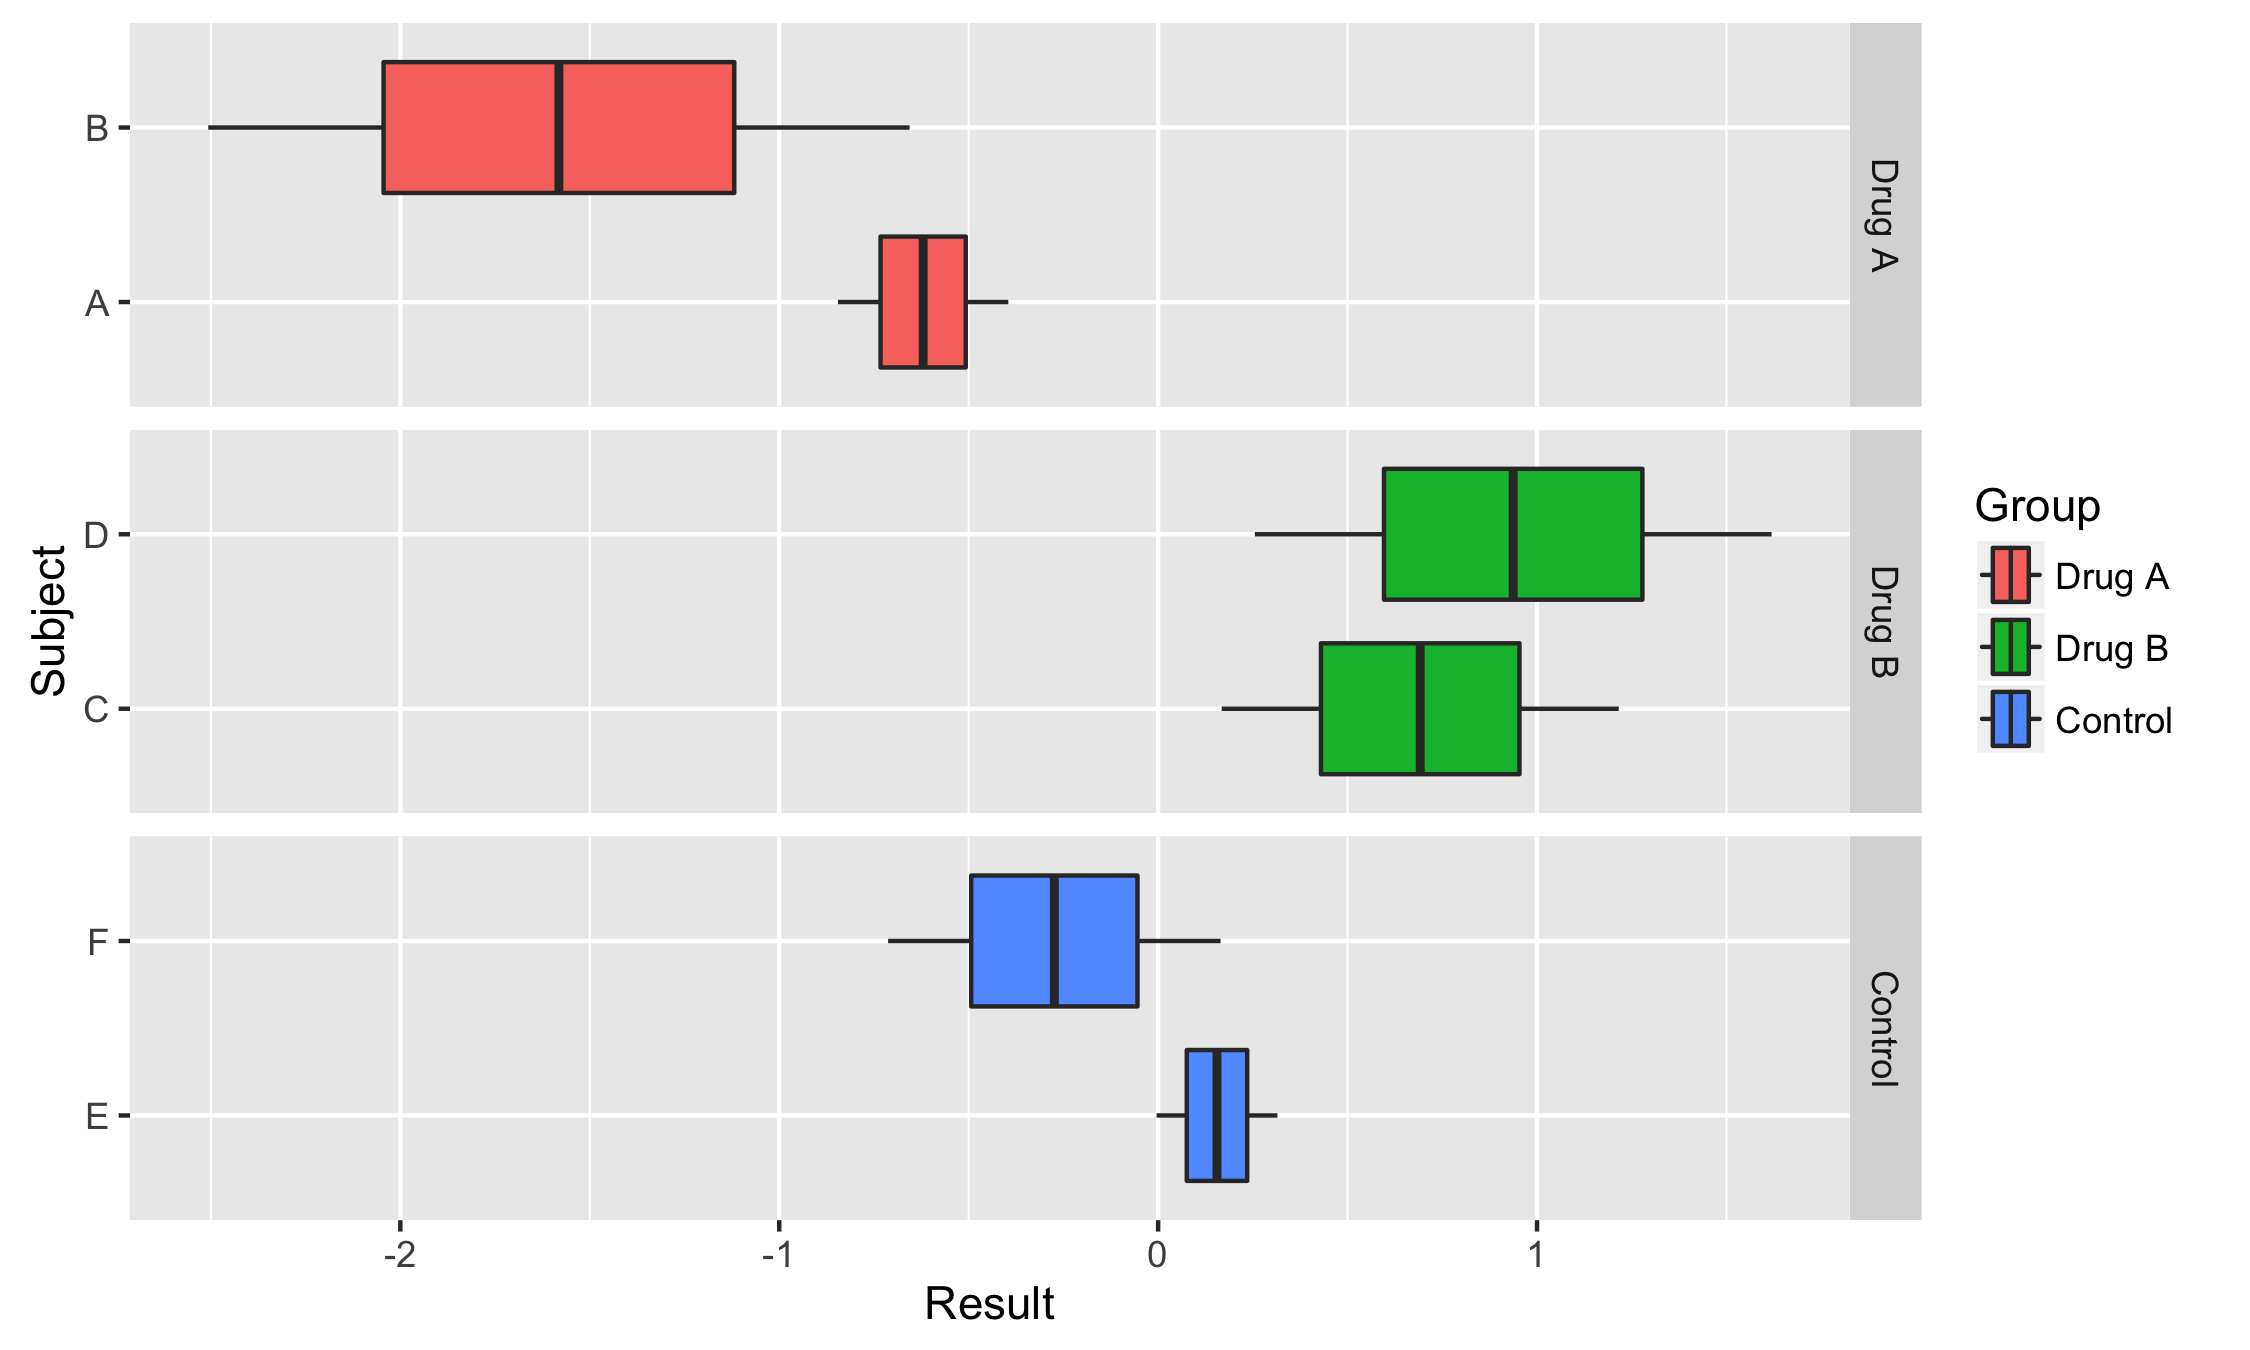
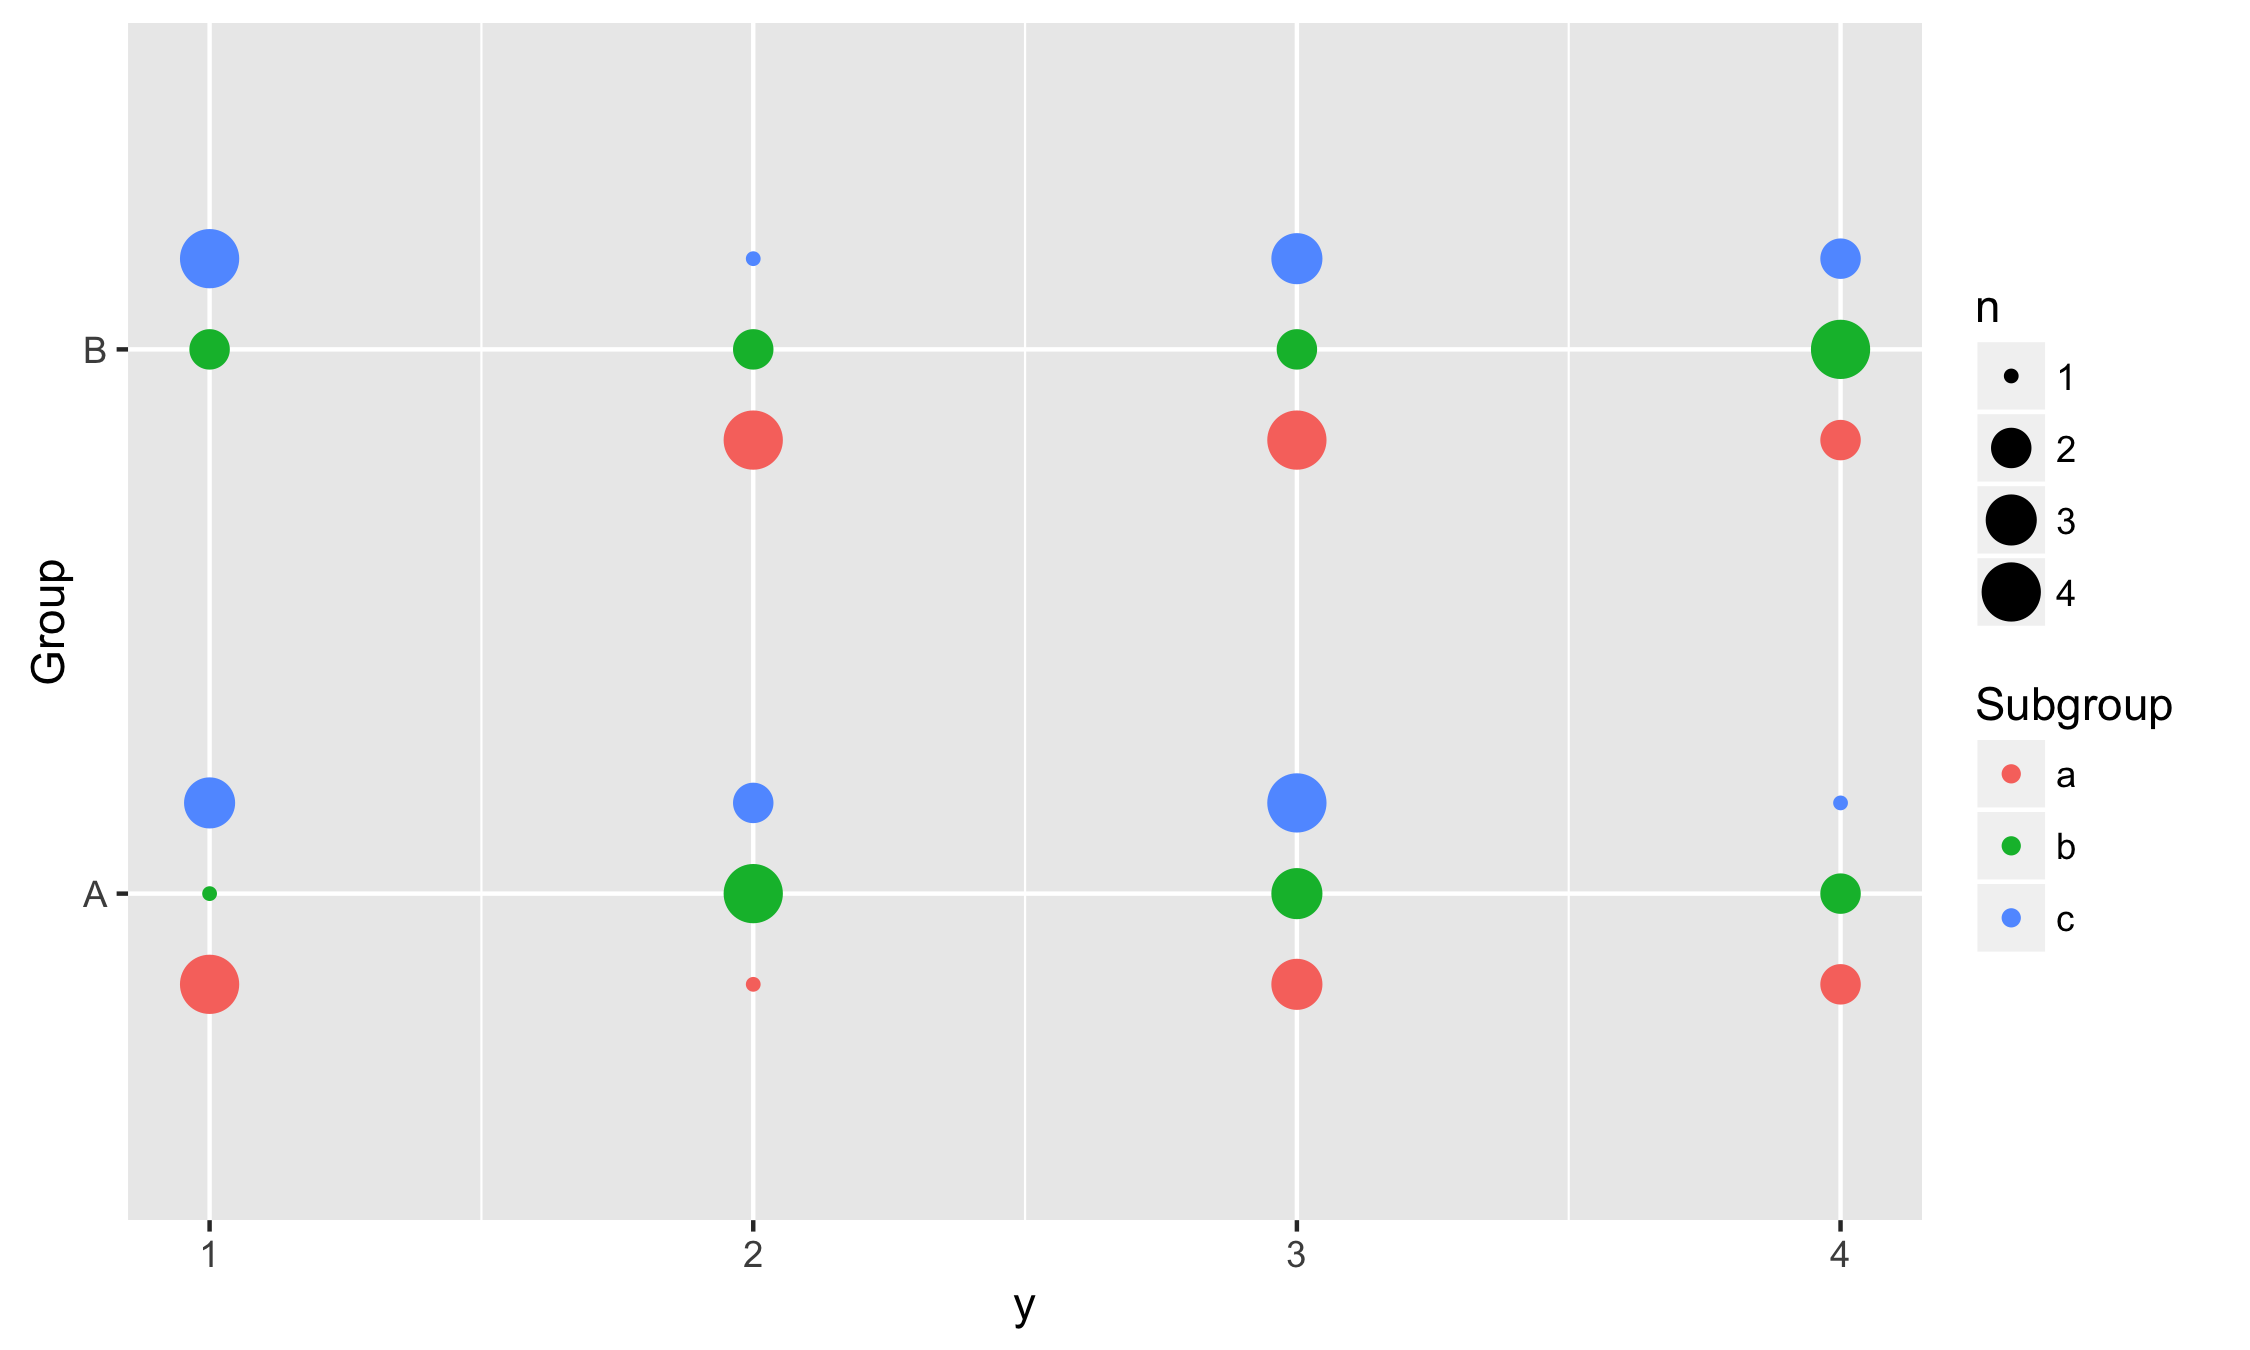
In this example we use vertical dodging to align measurements within subgroups.
data <- expand.grid(
  Group = c("A", "B"),
  Subgroup = c("a", "b", "c"),
  y = 1:10
)
data$y <- sample(1:4, replace = TRUE, size = nrow(data))

ggplot(data, aes(y, Group, colour = Subgroup)) +
  stat_sum(position = position_dodgev(height = 0.5))