Releases: msoechting/lexcube
Releases · msoechting/lexcube
Release list
v2.0.1

- Fix small datasets not rendering (closes #22, thanks @TheFpiasta)
- Fix colormap typo (thanks @TheFpiasta)
- Fix Python 3.13 issue (thanks @TheFpiasta)
- Fix integer data sets not rendering
Contributors

TheFpiasta
Assets 2
v2.0.0
Major v2.0 release 🎉
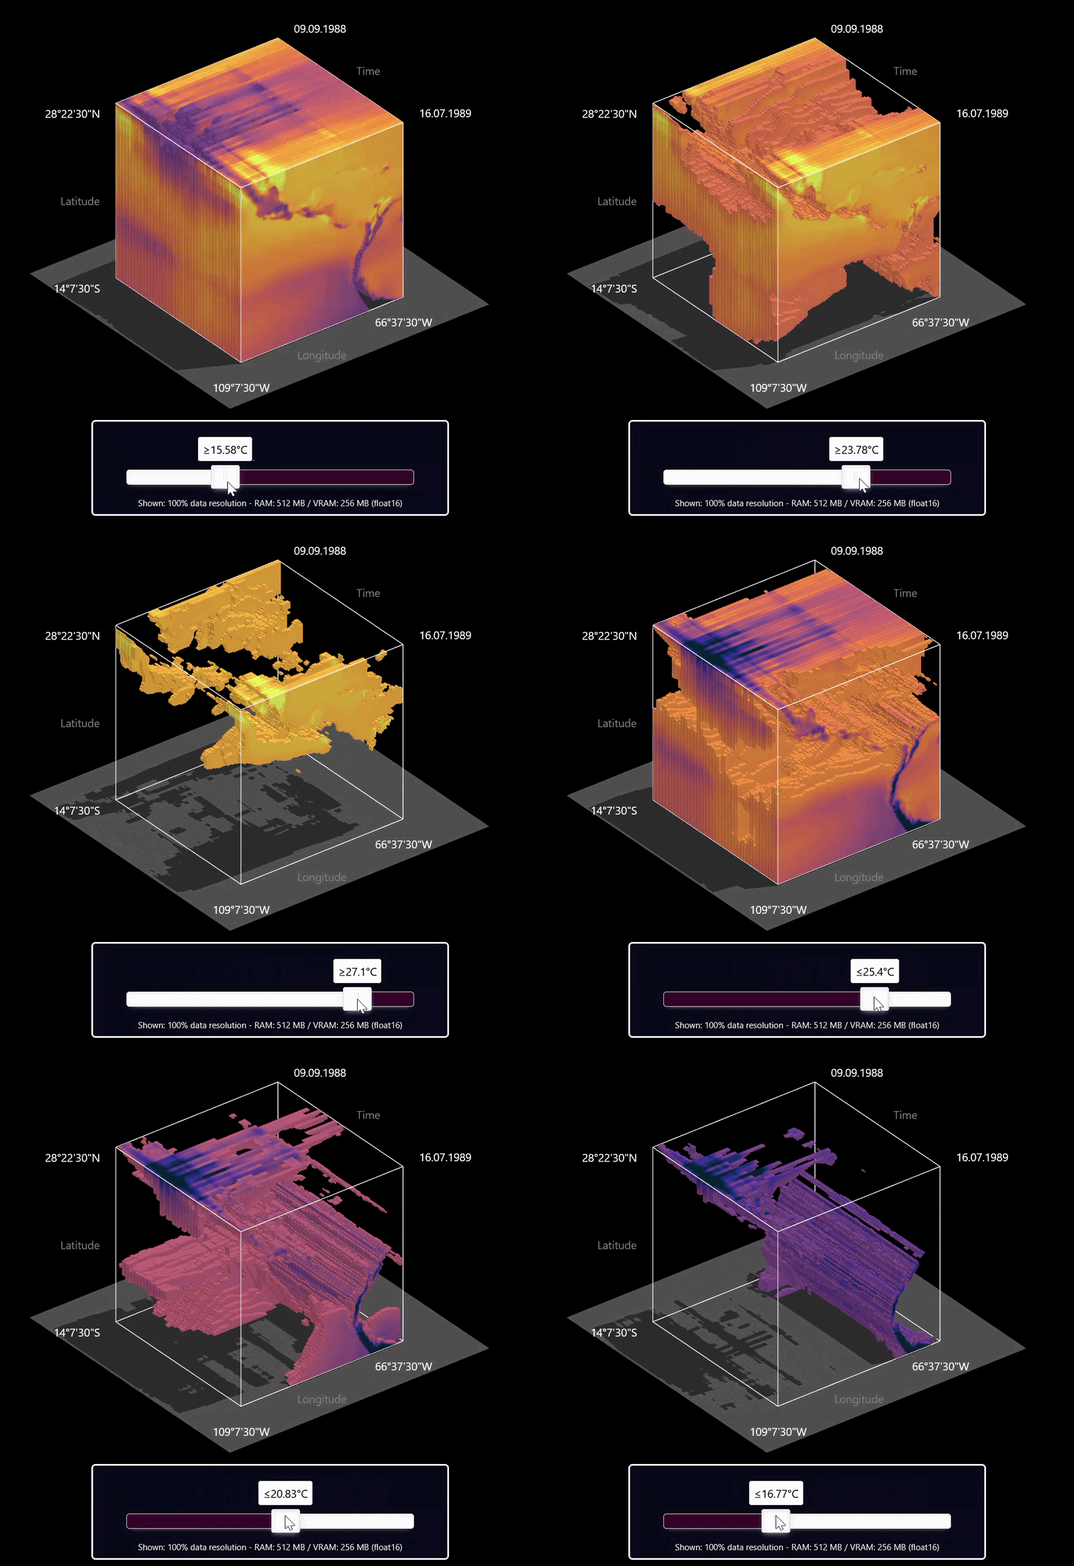
- 3D voxel mode - explore your 3D data cube down to every single observation!
- Time series - simply click on the cube to plot a time series at that location, synchronized to your current time range!
- And other bug fixes & performance improvements.
v1.0.4
Two new features for producing nice scientific data cube figures just dropped 🎉
- You can now scale the cube to be larger or smaller in any dimension, making a much nicer visualization for non-square/cube data sets (see below). See
cube_scalein the README. (#13) - Reproducibility! You can now save the camera angle of your visualization to perfectly reproduce the same cube visualization multiple times, e.g. with different data. See
camera_anglein the README. - Two attempted fixes for the strange dependency problems from #12 - removed
aiohttpas a dependency & upgradedipywidgetsto 8 while staying compatible with 7.

v1.0.3
- Small changes in build process - no user-facing changes
v1.0.2
- Fix vmin/vmax not being applied when set to zero
v1.0.1
- Add advanced capabilities to get_current_cube_selection
- Fix Numpy data sets not working
- Fix colormap not being applied from the constructor
v1.0 - Major Update! 🎉

- Load any GeoJSON (e.g. Natural Earth region borders) into the visualization as an overlay!
- Record a GIF/MP4/WebM animation from your cube!
- Dataset boundary indicators!
- Progress indicators (for chunked data sets)!
- Many various stability and performance improvements!
I appreciate all of your feedback and bug reports (via issues). Thanks for using Lexcube!
v0.4.23
-
Fix multiple bugs surrounding parameter ranges.
- This fixes every dimension maximum being off-by-1 in the visualization. (1st image below)
- This fixes pixels at a dimension maximum being repeated at the edge of each cube face. (2nd image below)
- All ranges now have an inclusive maximum, except for
xlim,ylimandzlimwhich still have an exclusive maximum.
-
Fix multiple rendering bugs.
- Fixes tiny grey pixel artifacts at cube edges in multiple scenarios. (3rd image below)
-
Fix animation settings window not disappearing (and not appearing) on touch/mouse hybrid devices.


v0.4.21
- Fix w.savefig() not working under certain circumstances
v0.4.20
- Add advanced animation controls when hovering over the animation button which allow fine-tuning of the animation parameters.