UI Screens
사용자가 전략 파라미터를 입력하고, 백테스트 실행 결과를 시각적으로 분석할 수 있도록 설계되었다.
- API 스키마 상세 → API-Endpoints & Schemas
- 저장 vs 파생 경계 → Reproducibility

- 전략 선택 (rule_type: RSI, MACD, RSI+MACD)
- 파라미터 입력 (initial_capital, fee_rate, position_size 등)
- 실행 요청 (POST /run_backtest)
- run_id 발급 →
/status/<run_id>폴링

- Total Return (%)
- Sharpe Ratio
- Max Drawdown (%)
- Number of Trades

시간에 따른 자산 가치 변화

전고점 대비 하락률 시각화
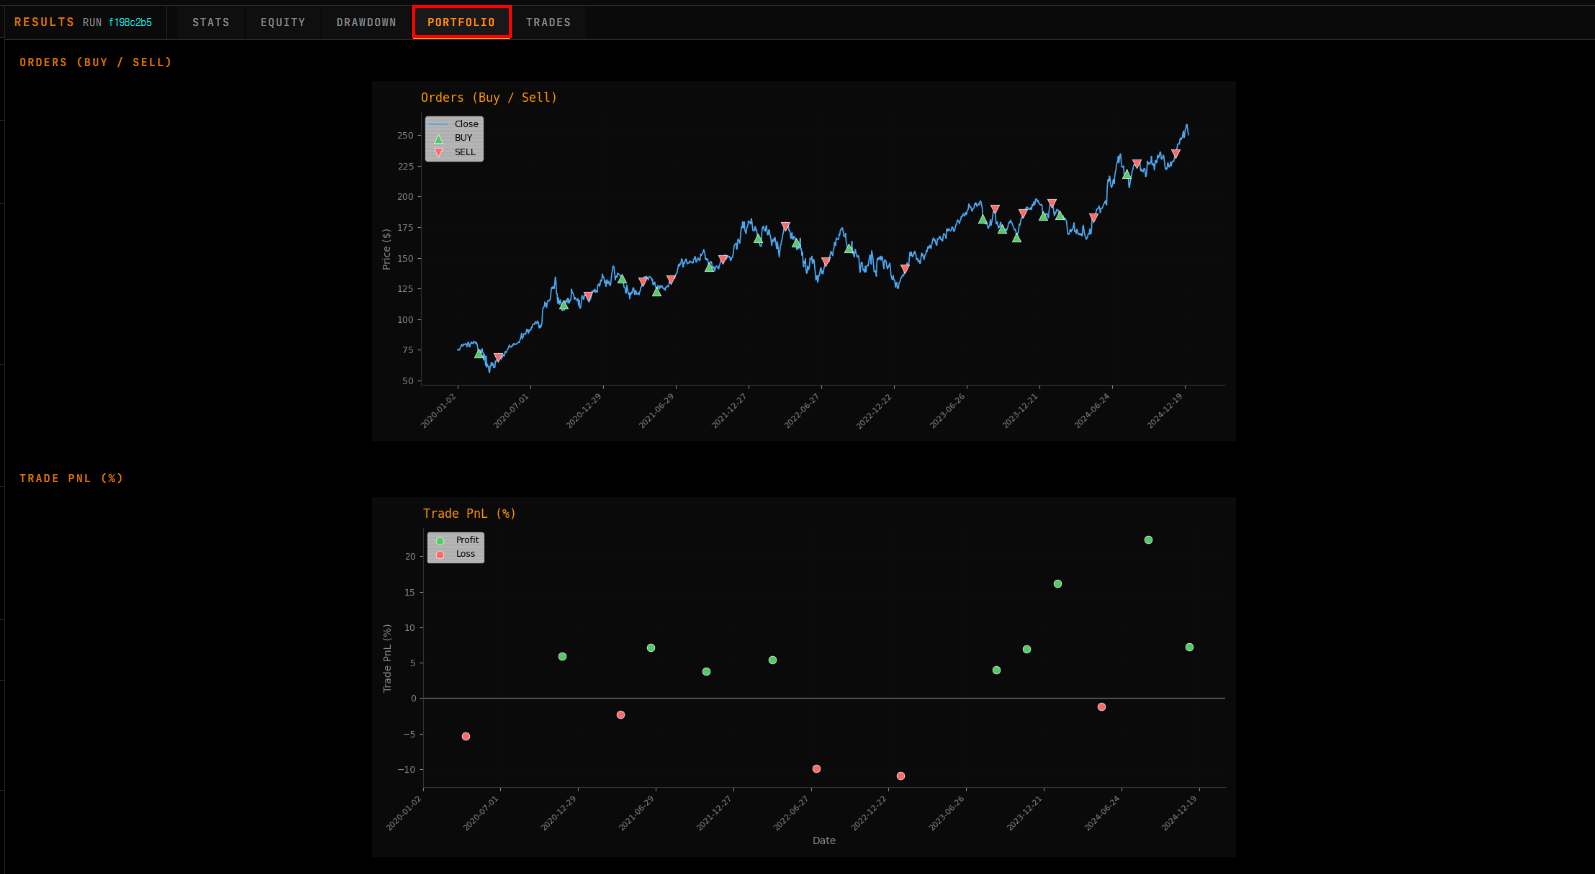
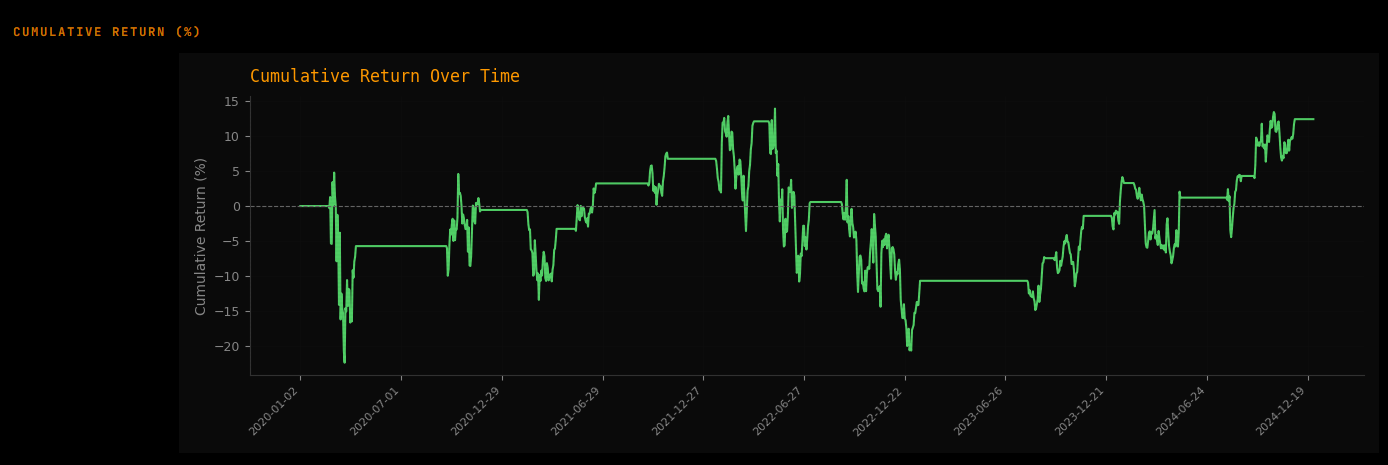
- Orders (Buy/Sell markers on price chart)
- Trade PnL (%) scatter
- Cumulative Return (%) line
각 탭이 요구하는 canonical 입력 데이터와 파생 차트를 정리한다.
| Tab | Canonical 입력 (DB 저장) | 파생 차트 (Adapter on-demand) |
|---|---|---|
| Stats (KPI) | metrics_json |
— (KPI 카드 직접 렌더링) |
| Equity Curve | equity_curve_json |
chart_base64 (SHOULD persist, legacy) |
| Drawdown | equity_curve_json |
drawdown_curve_base64 (MUST NOT persist) |
| Portfolio |
equity_curve_json + trades_json
|
portfolio_orders_base64, trade_pnl_base64, cumulative_return_base64 (MUST NOT persist) |
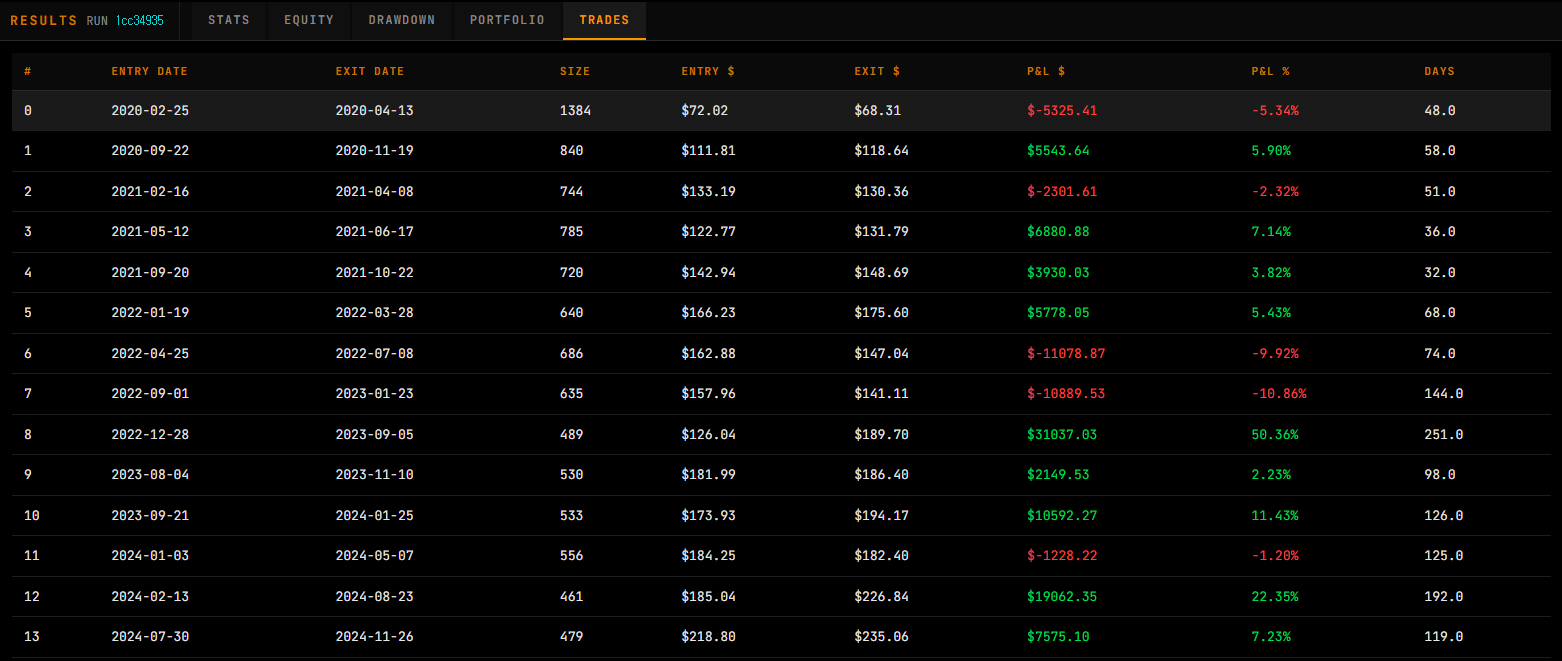
| Trades | trades_json |
— (테이블 직접 렌더링) |
핵심:
- DB에는 canonical data(
metrics_json,equity_curve_json,trades_json)만 저장 - 모든 차트는 Adapter Layer에서 요청 시 렌더링 (Matplotlib Agg → Base64)
-
chart_base64만 레거시 호환으로 SHOULD persist
MUST/SHOULD/MUST NOT 저장 경계 상세 → Reproducibility
- 서버 렌더링 차트 (Matplotlib Agg → Base64, Rule 5)
- Disk write 없음 (완전 Stateless, Rule 4)
- 입력 검증 실패 → 400 user_error
- 시스템 오류 → 500 system_error
- 모든 차트에서
plt.close(fig)호출 (메모리 누수 방지)
- API-Endpoints & Schemas — Request/Response 스키마
- Reproducibility — 저장 경계 (MUST/SHOULD/MUST NOT)
- App Architecture — Adapter Layer 구조
- Scope & Non-Goals — Candlestick chart 등 UI Non-Goals