





docker-staticmaps is an open-source API for rendering static map images. Easily create maps with markers, polygons, circles, polylines or text, making it perfect for embedding map images on websites or apps. Comes with built-in rate limiting and image caching to optimize performance and protect against abuse.
- ✅ Generate static maps with markers, polygons, circles, polylines and text.
- 🌍 Supports multiple basemaps (OpenStreetMap, Esri, Stamen, Carto, custom tile server).
- ⚡ Easy-to-use REST API - simple integration with any frontend or backend.
- 🐳 Docker-ready for fast, lightweight deployment.
- 🧊 Tile and image caching for performance.
- 🚦 Built-in rate limiting per IP to protect against abuse.
Run the service with Docker:
docker run -p '3000:3000/tcp' mxdcodes/docker-staticmaps:latestSend a sample request:
curl "http://localhost:3000/api/staticmaps?width=1000&height=1000¢er=-18.2871,147.6992&zoom=9&basemap=satellite"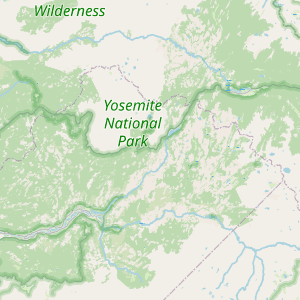
A small demo UI is available at http://localhost:3000
| Name | Type | Default Value | Description |
|---|---|---|---|
PORT |
number |
3000 |
Port number for the API |
API_KEY |
string |
(none) | Optional key to restrict access |
LOG_LEVEL |
string |
INFO |
Logging level (DEBUG, INFO, WARN or ERROR) |
TILE_CACHE_TTL |
number |
3600 |
Tile cache TTL in seconds. |
DISABLE_TILE_CACHE |
boolean |
false |
Set to true to disable tile caching |
RATE_LIMIT_MS |
number |
60000 |
Rate limit window in milliseconds |
RATE_LIMIT_MAX |
number |
60 |
Max requests per IP per window |
To run the container in detached mode:
docker run -d \
  --name='docker-staticmaps' \
  -p '3000:3000' \
  -e API_KEY="your_api_key" \
  -e LOG_LEVEL="INFO" \
  -e TILE_CACHE_TTL=3600 \
  -e DISABLE_TILE_CACHE=false \
  -e RATE_LIMIT_MS=60000 \
  -e RATE_LIMIT_MAX=60 \
  mxdcodes/docker-staticmaps:latest
Or use docker-compose.yml:
services:
  docker-staticmaps:
    image: mxdcodes/docker-staticmaps:latest
    container_name: docker-staticmaps
    restart: always
    ports:
      - "3000:3000"
    environment:
      - API_KEY=your_api_key
      - LOG_LEVEL=INFO
      - TILE_CACHE_TTL=3600
      - DISABLE_TILE_CACHE=false
      - RATE_LIMIT_MS=60000
      - RATE_LIMIT_MAX=60
A Healthcheck endpoint is available at /health.
Request static maps from the /api/staticmaps endpoint using the following parameters:
| Parameter | Default | Description |
|---|---|---|
center |
(required) | Center of map (lon,lat, e.g. -119.49280,37.81084) |
zoom |
(required) | Zoom level (1 to 18). |
| Parameter | Default | Description |
|---|---|---|
width |
800 |
Image width in pixels |
height |
800 |
Image height in pixels |
paddingX |
0 |
Horizontal padding in pixels |
paddingY |
0 |
Vertical padding in pixels |
format |
png |
Output format: png, jpg, webp or pdf |
quality |
100 |
Image quality (0–100) for jpg/webp |
basemap |
osm |
Tile layer (see Basemap for supported types) |
attribution |
Attribution text (see Attribution) | |
tileUrl |
Tile URL with {x}, {y}, {z} or {quadkey} placeholders |
|
tileSubdomains |
[] |
Tile subdomains like ['a', 'b', 'c'] |
tileLayers |
[] |
Multiple tile layers with tileUrl and tileSubdomains |
tileSize |
256 |
Size of tiles in pixels |
tileRequestTimeout |
Tile request timeout (ms) | |
tileRequestHeader |
{} |
Extra headers for tile requests |
tileRequestLimit |
2 |
Max parallel tile requests |
zoomRange |
{ min: 1, max: 17 } |
Min and max zoom to try |
reverseY |
false |
Use TMS-style Y axis if true |
Use the basemap parameter to select a predefined basemap or specify a custom tile server with the tileUrl parameter.
| Key | Provider / Type |
|---|---|
osm |
Open Street Map |
otm |
OpenTopoMap |
streets |
Esri Streets |
satellite |
Esri Satellite |
hybrid |
Esri Hybrid (satellite + labels) |
topo |
Esri Topographic |
gray |
Esri Gray w/ labels |
gray-background |
Esri Gray background only |
hillshade |
Esri Hillshade |
national-geographic |
National Geographic |
stamen-toner |
Stamen Toner (B/W) |
stamen-watercolor |
Stamen Watercolor |
carto-light |
Carto Light |
carto-dark |
Carto Dark |
Make sure to respect the usage policy of each provider!
The map service supports an optional attribution query parameter to control whether and how attribution is rendered on the generated image.
- Attribution is shown by default (if nothing is passed).
- If no custom text is provided, the service uses the default attribution for the selected basemap.
The attribution parameter accepts key-value pairs separated by |, for example:
&attribution=show:true|text:© OpenStreetMap contributors
| Key | Description | Example |
|---|---|---|
| show | true or false – controls visibility |
show:false |
| text | Custom attribution text (URL-encoded) | text:%C2%A9%20Your%20Company |
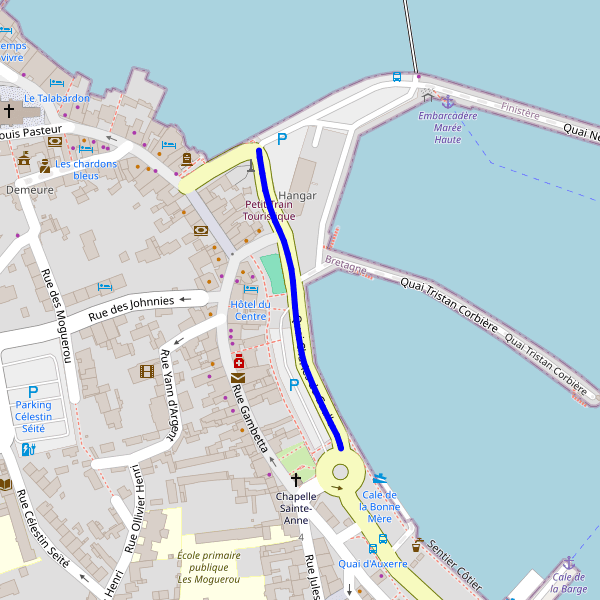
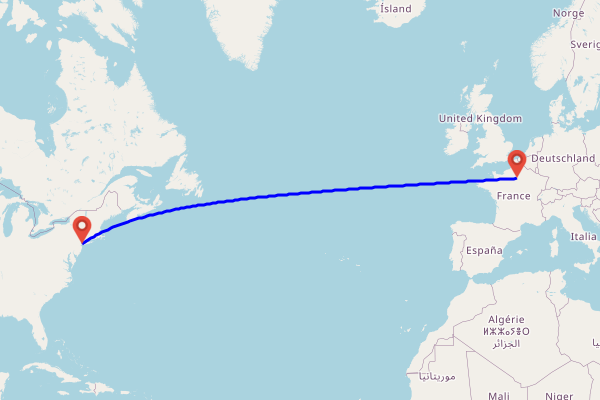
To add one or more polylines, use the polyline parameter one or multiple times in the URL query in the following format:
polyline=polylineStyle|polylineCoord1|polylineCoord2|...
-
polylineCoord:
- Lat, Lon Coordinates: Coordinates in
lat, lonformat, separated by|. You need at least two coordinates. - Encoded Polylines: You can also use Google Encoded Polyline format.
- Lat, Lon Coordinates: Coordinates in
-
polylineStyle: Customize the polyline with:
Parameter Default Description weight6Sets the stroke width of the polyline. color#0000ffDefines the stroke color of the polyline. fillSpecifies the fill color of the polyline. strokeDasharray(none) Pattern of dashes and gaps, e.g., 5,5see stroke-dasharray.
Note: For each pair of coordinates in the input, a geodesic line is generated between them.
Regular Coordinates example with no zoom, weight:6, color:0000ff
http://localhost:3000/api/staticmaps?width=1200&height=800&format=png&basemap=national-geographic&polyline=weight:6|color:red|37.2159,-7.0050|28.0997,-17.1092&polyline=weight:6|color:red|28.0997,-17.1092|24.0617,-74.4767&polyline=weight:6|color:red|24.0617,-74.4767|24.2000,-74.5000&polyline=weight:6|color:red|24.2000,-74.5000|23.1167,-82.3833&polyline=weight:6|color:red|23.1167,-82.3833|19.0000,-72.7000
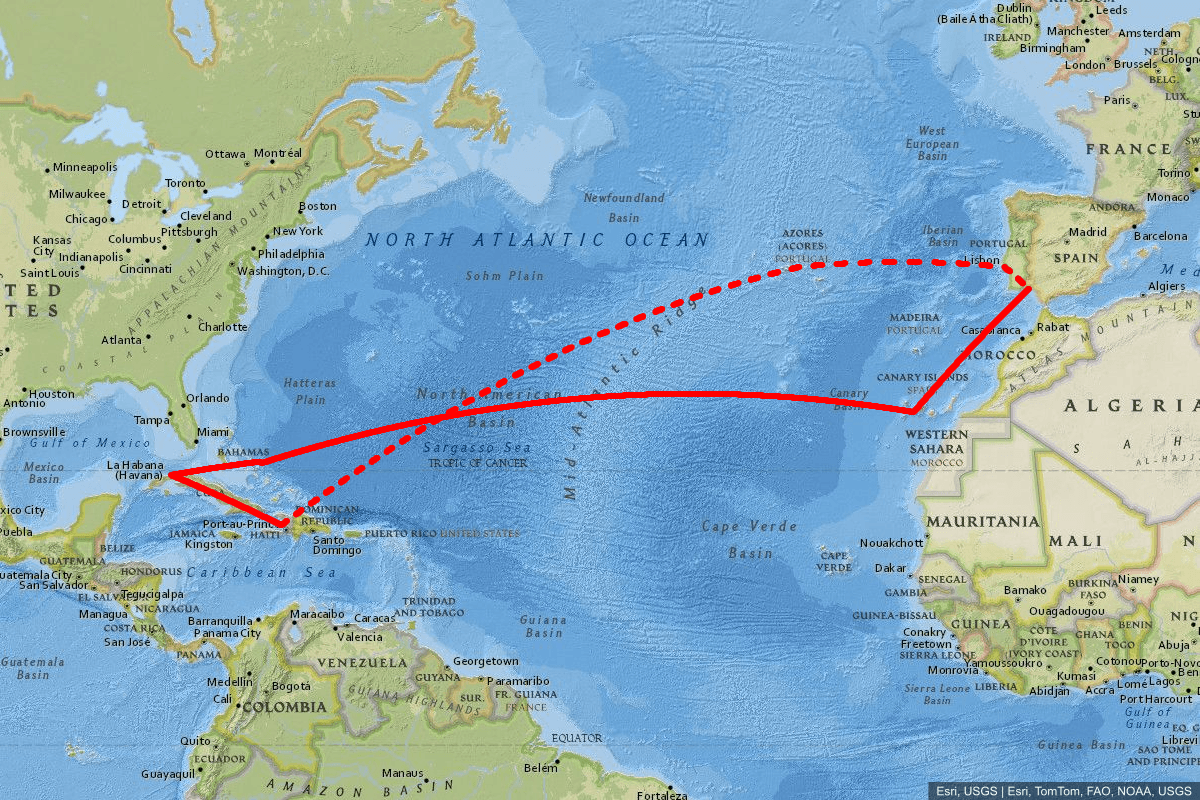
Multiple Encoded Polylines
http://localhost:3000/api/staticmaps?width=1200&height=800&format=png&basemap=national-geographic&polyline=weight:6|color:red|kvcbFfdwi@fosv@fnt|@ntsWzqc}Ik_ZrpCrqrErubo@j`cXsgbz@&polyline=weight:6|color:red|strokeDasharray:10,15|_}}rB~evzLs}iwBseqtG?_{jmBfddHc~_L
To add a polygon, use the polygon parameter in this format:
polygon=polygonStyle|polygonCoord1|polygonCoord2|...
-
polygonCoord: List of coordinates in
lat, lonformat, separated by|. The first and last coordinates should be the same to close the polygon. -
polygonStyle: Customize the polygon with:
Parameter Default Description color#4874dbDefines the stroke color of the polygon. weight5Sets the stroke width of the polygon. fillSpecifies the fill color of the polygon. strokeDasharray(none) Pattern of dashes and gaps, e.g., 5,5see stroke-dasharray.
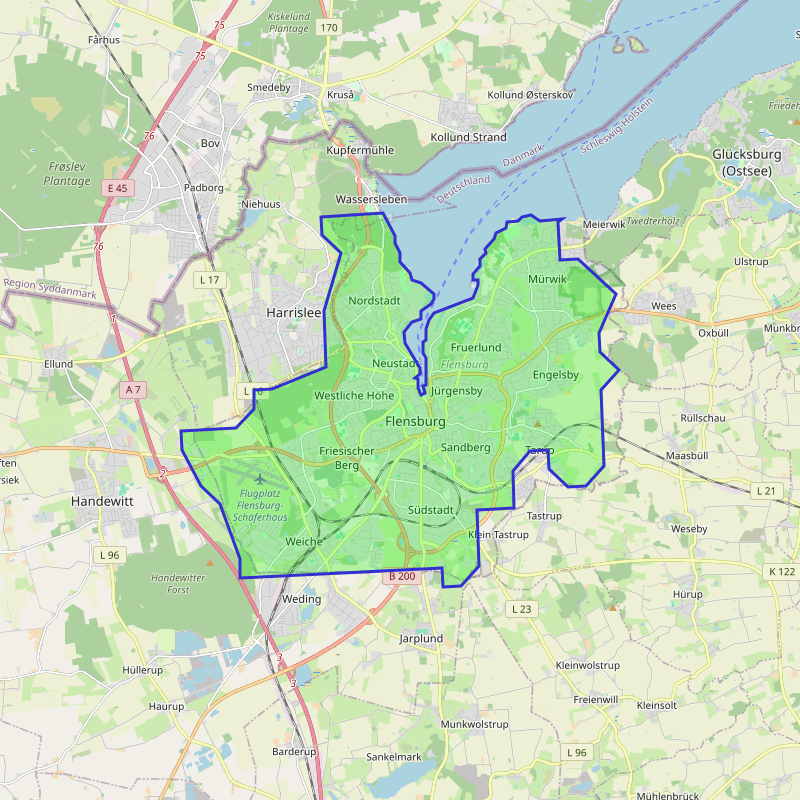
Example: Polygon with color 4874db, weight 7, and fill eb7a34
http://localhost:3000/api/staticmaps?width=800&height=800&basemap=satellite&polygon=color:332fd0|weight:3|fill:00FF003F|54.82446670532232,9.421944618225211|54.81986236572277,9.426388740539608|54.818473815918026,9.426388740539608|54.8165283203125,9.428054809570256|54.814861297607365,9.428054809570256|54.812637329101676,9.431389808654785|54.81124877929693,9.43194580078125|54.81069564819336,9.435277938842773|54.80847167968744,9.43972206115734|54.80736160278332,9.43972206115734|54.806526184082145,9.43861007690441|54.8051376342774,9.435277938842773|54.803470611572266,9.435277938842773|54.802917480468864,9.43194580078125|54.800971984863395,9.429166793823185|54.79875183105469,9.429720878601074|54.79375076293945,9.434721946716252|54.7926406860351,9.434721946716252|54.791805267333984,9.433055877685604|54.791526794433594,9.43416786193859|54.78985977172863,9.43416786193859|54.788471221923885,9.435277938842773|54.788749694824276,9.436389923095703|54.79013824462902,9.435833930969238|54.79041671752941,9.436944007873592|54.79569625854498,9.436945915222168|54.79680633544933,9.435833930969238|54.79902648925787,9.435833930969238|54.79930496215826,9.436944007873592|54.80152893066412,9.436944007873592|54.803195953369254,9.438055992126522|54.80458450317383,9.43972206115734|54.80764007568365,9.453055381774902|54.81013870239258,9.454723358154297|54.81124877929693,9.454723358154297|54.81124877929693,9.453055381774902|54.812362670898494,9.453055381774902|54.81402587890625,9.455277442932186|54.81541824340832,9.455277442932186|54.8165283203125,9.457498550415039|54.81735992431646,9.456946372985897|54.81930541992199,9.460277557373104|54.82041549682617,9.460833549499569|54.82152938842768,9.464165687561035|54.82263946533203,9.4647216796875|54.82291793823242,9.468609809875431|54.823749542236385,9.469721794128361|54.824028015136776,9.473056793212947|54.82291793823242,9.47583293914795|54.82319259643566,9.483611106872559|54.82273864746105,9.482230186462402|54.815219879150504,9.482759475708065|54.81542968750006,9.488989830017147|54.80834197998047,9.501990318298454|54.80062103271496,9.496249198913574|54.79687118530285,9.496500015258846|54.793331146240234,9.502988815307617|54.789379119873104,9.496978759765625|54.77442932128912,9.497907638549862|54.77051162719732,9.491870880126896|54.7703094482423,9.48559856414795|54.773860931396484,9.479109764099235|54.77759170532232,9.478879928588924|54.77740097045904,9.472619056701717|54.77347946166992,9.466569900512752|54.76604080200195,9.466990470886344|54.765670776367244,9.454428672790527|54.75452041625982,9.4550399780274|54.75062942504883,9.448939323425293|54.75045013427746,9.44265079498291|54.75416183471691,9.442468643188477|54.75226974487316,9.373150825500545|54.75595855712902,9.372980117797795|54.76689147949213,9.366157531738338|54.77040863037115,9.359689712524414|54.777629852295036,9.353049278259391|54.78133010864258,9.352879524230957|54.78186035156256,9.371758460998592|54.78573989868164,9.377868652343864|54.789451599121094,9.377679824829158|54.78963851928722,9.383960723876953|54.79391860961914,9.402589797973633|54.80508041381847,9.401970863342285|54.816478729248104,9.40755939483654|54.82001113891596,9.401079177856445|54.823760986328125,9.400839805603084|54.82446670532232,9.421944618225211&polygon=color:FF5733|weight:2|fill:FF00003F|54.780,9.390|54.782,9.392|54.784,9.391|54.785,9.389|54.784,9.387|54.782,9.386|54.780,9.387|54.779,9.388|54.780,9.390
To add one or more markers, use the markers parameter in this format:
markers=markerStyle|markerCoord1|markerCoord2|...
-
markerCoord: Coordinates for each marker in
lat, lonformat, separated by|. You need at least one coordinate. -
markerStyle: Customize the marker with:
Parameter Default Description img(optional) URL or file path for a custom marker image. color#d9534fColor of the Marker. width28Width of marker image in px. height28Height of marker image in px. drawWidthwidthResize marker image to width in px. drawHeightheightResize marker image to height in px. offsetX13.5Horizontal offset for the marker position. offsetY27.5Vertical offset for the marker position. resizeModecoverApplied resize method if needed. See: https://sharp.pixelplumbing.com/api-resize
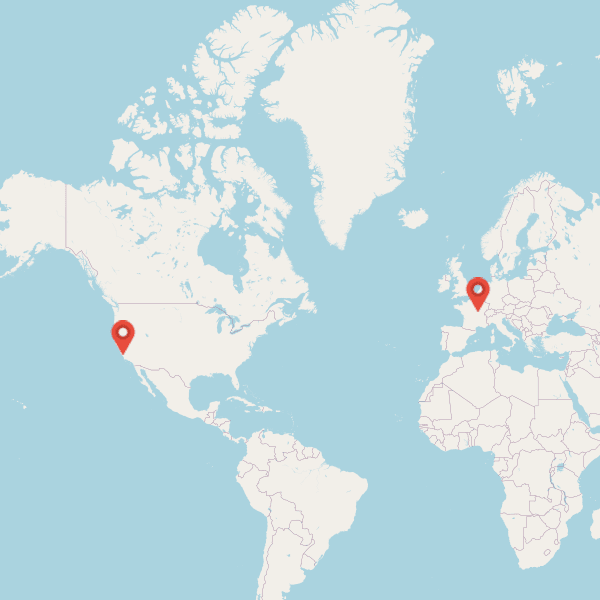
Example: Multiple Markers
http://localhost:3000/api/staticmaps?width=1200&height=800&format=png&basemap=national-geographic&markers=color:red|37.2159,-7.0050|28.0997,-17.1092|24.0617,-74.4767|24.2000,-74.5000|23.1167,-82.3833|19.0000,-72.7000|38.7169,-27.2231|38.7169,-9.1399|37.2159,-7.0050&markers=color:green|36.5271,-6.2886|15.4150,-61.3710|16.2650,-61.5510|18.4655,-66.1057|18.4861,-69.9312|21.5218,-77.7812&markers=color:orange|36.7781,-6.3515|14.9167,-23.5167|10.6000,-61.2000|8.5833,-62.4000|18.4861,-69.9312&markers=color:blue|36.5271,-6.2886|17.9352,-76.8419|15.9194,-85.9597|9.3547,-79.9014|21.5218,-77.7812|36.5271,-6.2886
To add a circle, use the circle parameter in this format:
circle=circleStyle|circleCoord
-
circleCoord: Coordinates for the circle's center in lat, lon format, separated by |. You need at least one coordinate.
-
circleStyle: Customize the circle with:
Parameter Default Description radius(required) Specifies the radius of the element. color#0000bbDefines the stroke color of the element. width3Sets the stroke width of the element. fill{color}Specifies the fill color of the element.
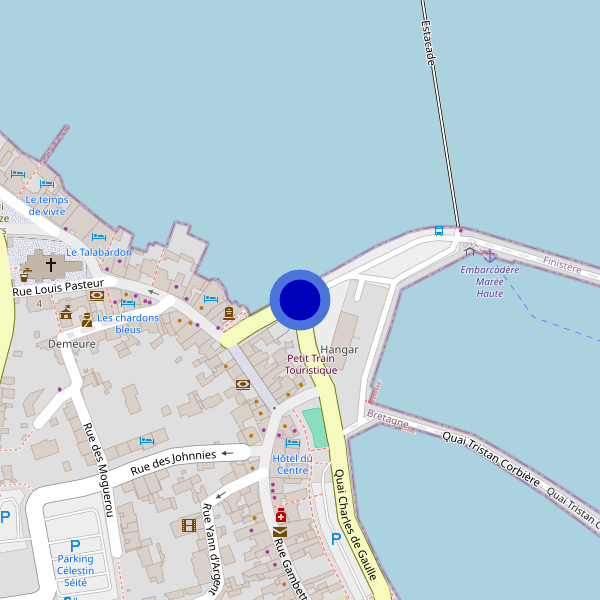
Example: Circle with a radius of 20 meters.
http://localhost:3000/api/staticmaps?width=600&height=600&basemap=osm&circle=radius:20|color:4874dbb2|fill:0000bbbd|width:10|48.726304979176675,-3.9829935637739382
To add text, use the text parameter in this format:
text=textStyle|textCoord
-
textCoord: Coordinates for the text's anchor in lat, lon format.
-
textStyle: Customize the text with:
Parameter Default Description text(required) The text to render. color#000000BBStroke color of the text width1Stroke width of the text fill#000000Fill color of the text size12Font-size of the text fontArialFont-family of the text anchorstartDetermines the text anchor alignment. offsetX0Horizontal offset relative to the coordinate. offsetY0Vertical offset relative to the coordinate.
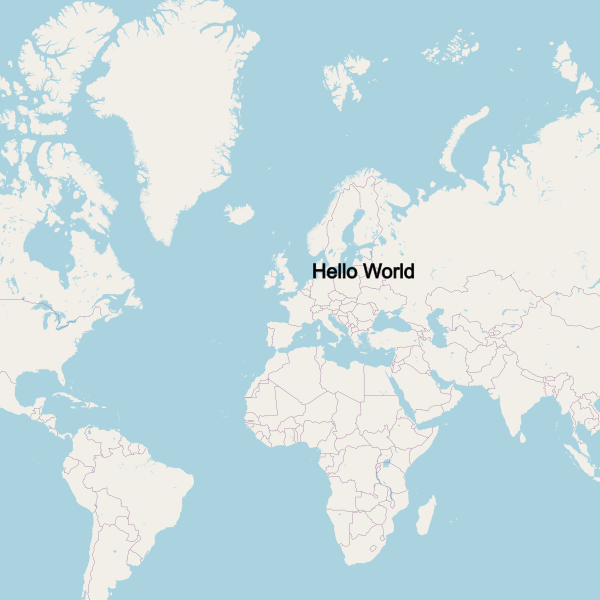
Example: Text "Hello World" with custom styling.
http://localhost:3000/api/staticmaps?width=600&height=600&text=text:Hello%20World|size:20|48.8566,2.3522
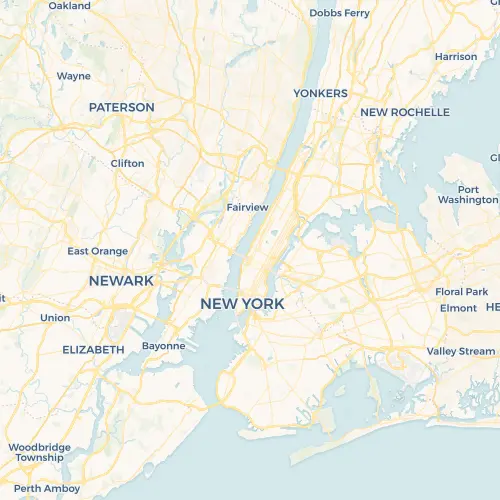
Example with width=500, height=500, center=-73.99515,40.76761, zoom=10, basemap=national-geographic
http://localhost:3000/api/staticmaps?width=500&height=500¢er=40.76761,-73.99515&zoom=10&format=webp&basemap=national-geographic
Multiple Markers and multiple Polylines with encodedPolyline aswell as lon,lat coordinatesExample and a custom attribution
http://localhost:3000/api/staticmaps?width=1200&height=800&format=png&basemap=national-geographic&polyline=weight:6|color:red|kvcbFfdwi@fosv@fnt|@ntsWzqc}Ik_ZrpCrqrErubo@j`cXsgbz@&polyline=weight:6|color:red|strokeDasharray:10,15|_}}rB~evzLs}iwBseqtG?_{jmBfddHc~_L&polyline=weight:6|color:green|ke}}Evfke@rmz_C~geoIo_eD~cb@cxlLzqxZw_CjdjVc|oQne|n@&polyline=weight:6|color:orange|cfn_Fzowe@vxldCnqwgBjbjYr__eFj{hK~jiFocm{@~|}l@@&polyline=weight:6|color:blue|ke}}Evfke@jfnpBb}rmLvuhKfysv@jdag@kg~c@kkgiAgb}KcvqzAwkjsL&text=text:First%20Voyage%20(1492%E2%80%931493)|size:20|color:red|38.7169,-27.2231&text=text:Second%20Voyage%20(1493%E2%80%931496)|size:20|color:green|offsetX:-230|18.4655,%20-66.1057&text=text:Third%20Voyage%20(1498%E2%80%931500)|size:20|offsetY:-10|color:orange|8.5833,-62.4000&&text=text:Fourth%20Voyage%20(1502%E2%80%931504)|size:20|color:blue|offsetY:-30|offsetX:50|9.3547,-79.9014&markers=color:red|37.2159,-7.0050|28.0997,-17.1092|24.0617,-74.4767|24.2000,-74.5000|23.1167,-82.3833|19.0000,-72.7000|38.7169,-27.2231|38.7169,-9.1399|37.2159,-7.0050&markers=color:green|36.5271,-6.2886|15.4150,-61.3710|16.2650,-61.5510|18.4655,-66.1057|18.4861,-69.9312|21.5218,-77.7812&markers=color:orange|36.7781,-6.3515|14.9167,-23.5167|10.6000,-61.2000|8.5833,-62.4000|18.4861,-69.9312&markers=color:blue|36.5271,-6.2886|17.9352,-76.8419|15.9194,-85.9597|9.3547,-79.9014|21.5218,-77.7812|36.5271,-6.2886&attribution=text:Esri,%20USGS%20Esri,%20TomTom,%20FAO,%20NOAA,%20USGS
Also, POST requests are supported:
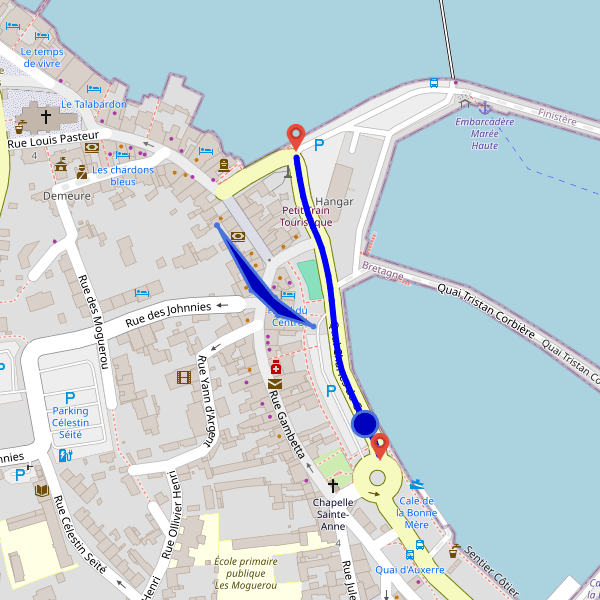
Example with markers, polyline, polygon and circle
curl -X POST http://localhost:3000/api/staticmaps \
  -H "Content-Type: application/json" \
  -H "x-api-key: yourSecretApiKeyHere" \
  -d '{
    "width": 600,
    "height": 600,
    "polyline": [
      {
        "weight": 6,
        "color": "#0000ff",
        "coords": [
          [-74.006, 40.7128],
          [18.424055, -33.924869]
        ]
      },
      {
        "weight": 6,
        "color": "red",
        "coords": [
          [2.352222, 48.856614],
          [18.424055, -33.924869]
        ]
      }
    ],
    "markers": {
      "coords": [
        [2.352222, 48.856614],
        [-74.006, 40.7128],
        [18.424055, -33.924869]
      ]
    }
  }' --output custom_map.png
To run the project locally, follow these steps:
- Clone the repository:
git clone https://github.com/dietrichmax/docker-staticmaps- Install the dependencies:
npm install- Start the development server:
npm run devEnjoy building and customizing your static maps! 🌍✨