Conversation
 nvictus
left a comment
nvictus
left a comment
There was a problem hiding this comment.
The only urgent thing is the output of the digitized track and bin edges. I think it would make more sense to save them as a BED-like file, and maybe optionally the saddledata as a npy.
cooltools/cli/compute_saddle.py
Outdated
| # # ... | ||
| # from bioframe.io import formats | ||
| # from bioframe.schemas import SCHEMAS | ||
| # formats.read_table(track_path, schema=SCHEMAS["bed4"]) |
There was a problem hiding this comment.
Technically, these types of files with non-overlapping segmentations of quantitative data are called bedGraph, so it would be schema='bedGraph'. But bioframe isn't ready to be a dependency yet, though soon it should.
There was a problem hiding this comment.
mentioned that we might switch to bioframe in the future for input validation etc.
corrected schema reference.
cooltools/cli/compute_saddle.py
Outdated
| # # just like in diamond_insulation: | ||
| if output is not None: | ||
| # output saddledata (square matrix): | ||
| pd.DataFrame(saddledata).to_csv(output+".saddledata.tsv", |
There was a problem hiding this comment.
This is fine. An alternative way to do the same is np.savetxt, but even less flexible. You could also output .npy if that extension is used instead.
There was a problem hiding this comment.
see reply for the next comment
cooltools/cli/compute_saddle.py
Outdated
| index=False, | ||
| header=False, | ||
| na_rep='nan') | ||
| # output digitized track: |
There was a problem hiding this comment.
Couldn't we output the digitized track and binedges as a single bedGraph file?
There was a problem hiding this comment.
So, the idea here was to output data needed to plot saddleplot from scratch, e.g.,
provide necessary inputs for the saddle.saddleplot function: binedges, digitized, saddledata.
100% agree we should store them as a single container, rather than 3 text files ...
also digitized by its nature is a begGraph, in fact, it is the same exact bedGraph that users would provide as TRACK_PATH, with actual values replaced with digitized indices.
However, binedges is simply an array of edges for those digitized indices, e.g..,if binedges=[-0.1,-0.05,0,...], then values from track that are <-0.1 would assigned digitized index 0, values between -0.1 and -0.05 are assigned digitized index 1, etc.
So, how exactly would binedges fit into bedGraph schema ?
Can we just output binedges, digitized, saddledata as a single npz container ?
Potentially adding a 4th thing there: actual 1D histogram from saddleplot in a form of bins and counts (I think we'd need new bins , again , since binedges in this case are made up of digitized values, not the initial values from the track)
There was a problem hiding this comment.
about bedGraph:
is the original track:
   chrom   start      end    eigen
0  chr10       1   200000  0.02511
1  chr10  200001   400000  0.04261
2  chr10  400001   600000  0.04836
3  chr10  600001   800000  0.05034
4  chr10  800001  1000000  0.05601
...
then bedGraph-like data structure that includes both original 'eigen' and digitized one would look like:
    chrom    start      end    eigen  digitized.eigen
0   chr10        1   200000  0.02511               13
1   chr10   200001   400000  0.04261               15
2   chr10   400001   600000  0.04836               15
3   chr10   600001   800000  0.05034               16
4   chr10   800001  1000000  0.05601               16
5   chr10  1000001  1200000  0.03689               14
6   chr10  1200001  1400000 -0.01956                7
7   chr10  1400001  1600000 -0.03823                5
8   chr10  1600001  1800000 -0.04384                5
9   chr10  1800001  2000000 -0.04233                5
...
so what exactly do we want to store? 100% bedGraph compliant thing:
chrom    start      end  digitized.eigen
chr10        1   200000               13
chr10   200001   400000               15
chr10   400001   600000               15
chr10   600001   800000               16
...
or a dataframe with eigen and digitized.eigen (which isn't a bedGraph anymore).
we could also add binedges here in a form of another start_eigen, stop_eigen columns:
    chrom    start      end    eigen  digitized.eigen  start_eigen  stop_eigen
0   chr10        1   200000  0.02511               13     0.023993    0.032685
1   chr10   200001   400000  0.04261               15     0.041377    0.050069
2   chr10   400001   600000  0.04836               15     0.041377    0.050069
3   chr10   600001   800000  0.05034               16     0.050069    0.058761
4   chr10   800001  1000000  0.05601               16     0.050069    0.058761
5   chr10  1000001  1200000  0.03689               14     0.032685    0.041377
6   chr10  1200001  1400000 -0.01956                7    -0.028160   -0.019468
7   chr10  1400001  1600000 -0.03823                5    -0.045544   -0.036852
8   chr10  1600001  1800000 -0.04384                5    -0.045544   -0.036852
9   chr10  1800001  2000000 -0.04233                5    -0.045544   -0.036852
10  chr10  2000001  2200000 -0.04399                5    -0.045544   -0.036852
11  chr10  2200001  2400000 -0.04955                4    -0.054236   -0.045544
12  chr10  2400001  2600000 -0.04825                4    -0.054236   -0.045544
thus binedges would be implicitly included here...
array([-0.0803127 , -0.07162058, -0.06292847, -0.05423635, -0.04554423,
       -0.03685212, -0.02816   , -0.01946788, -0.01077577, -0.00208365,
        0.00660847,  0.01530058,  0.0239927 ,  0.03268482,  0.04137693,
        0.05006905,  0.05876117,  0.06745328,  0.0761454 ])
There was a problem hiding this comment.
Interesting... Let's put it on hold and for now just output binedges, hist_counts and saddledata to a single npz. The saddleplot function could probably be modified to take pre-histogrammed counts as input. Obtaining digitized tracks is a separate concern.
There was a problem hiding this comment.
done!
The only thing though, is that digitized is a dict internally, and when savez-ed it is being wrapped into an ndarray with shape () - so you cannot extract that dict by simply saying npz['digitized'][0] (I couldn't at least), so https://stackoverflow.com/questions/24565916/why-is-numpy-shape-empty suggest using npz['digitized'].item().
I've documented that stuff in the output option help message.
| try: | ||
| import matplotlib as mpl | ||
| # savefig only for now: | ||
| mpl.use('Agg') |
There was a problem hiding this comment.
Yes! This should be the default, especially if running on headless computers.
There was a problem hiding this comment.
yeah, it was simply copy/pasted from your cooler_show implementation: https://github.com/mirnylab/cooler/blob/master/cooler/cli/show.py
|
it seems to be mostly done for the initial iteration. I added one thing though, - computation of the compartment strength, it's not very flexible but experimental people are asking for it... very much so. Let me know if you think that the naive strength calculation is too misleading, or not robust enough even to be included in this initial iteration. |
saddle cli conversation starter ...
There are too many things going on at the same time, for me alone to decide everything.
groupbyto using pandas indexingTODO:
IMPORTANT:
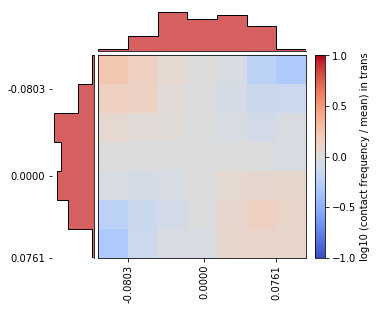
added some fixes into
saddle.pysaddledatamatrixbefore it looked like that:
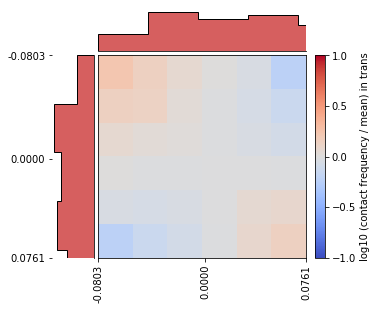
now it looks this way: